-
Download and install FTDI drivers from VCP Drivers - FTDI
-
Connect the debugger to PC USB and check the device manager to see if the drivers are installed properly:
-
Download Zadig tool from https://zadig.akeo.ie/
-
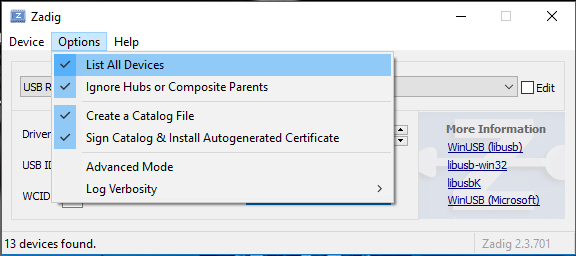
Open Zadig Tool and go to Options->List All Devices
5.Select the FT2232 channel you want to use as Jtag.
In case of Wrover-Kit, is channel 0: “Dual RS232-HS (interface 0)”, according to Wrover-Kit schematic:
If you use FT2232h minimodule, you can use any channel.
The debugger work’s with FT4232h minimodule too (tested).
In this case, you have 4 channels to chose from ![]()
It work’s even with cheap FT232x chip (ex. UM232H , UM232H-B modules).
- Select WinUSB
- Click Replace Driver
After operation completed, disconnect and reconnect the device to USB port
Now you can use PIO Debugger on ESP32
PS.
In case that other channel (channel 1 in case of wrover-kit) is not detected as com port (used by esptool for flashing),
you must enable the VCP mode on channel 1, this way:
- On device manager, right click on “USB Serial Converter B” - >Properties ->Advanced
- Select “Load VCP” then click OK.
Then, the FT2232 channel 2 should be detected as Com Port on device manager:

