ESP-PROG Debugger throwing Fatal Error

Hi.

I’m having trouble getting an ESP-Prog debugger to work.
I have listened to the how to’s from Spiess and Lough, and read ths carefully.
from the docs

As a preface I have a simple program that I can upload to a generic ESP32 BOARD (the board appears as USB-SERIAL CH340 (COM6)) the program works.

I have tried to setup the debugger as per the instructions, i.e.

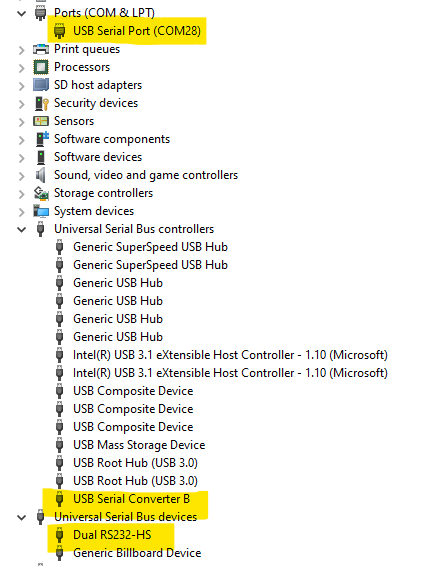
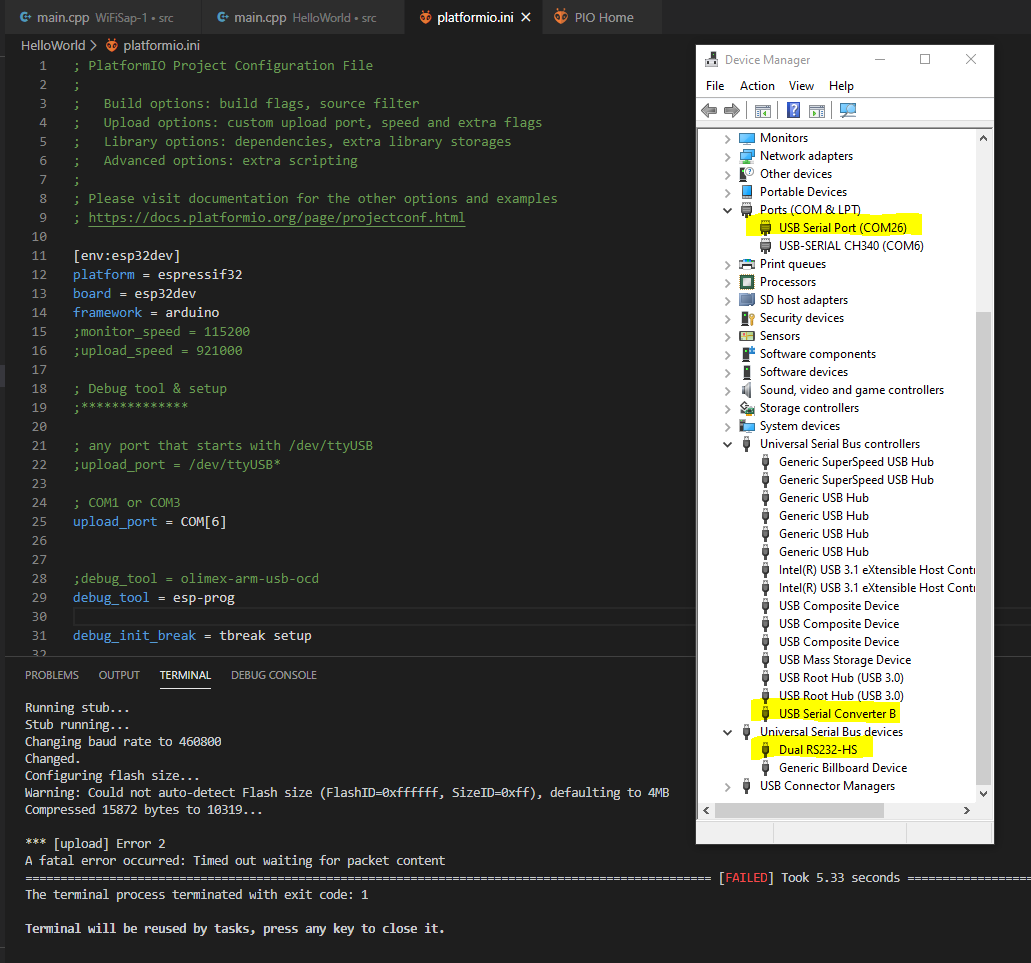
I installed the FTDI drivers and converted USB Serial Convertor A into a Dual RS232-HS device; this now shows as USB Serial Port (COM26). However, when I compile and upload the the code, I get the following error.

Warning: Could not auto-detect Flash size (FlashID=0xffffff, SizeID=0xff), defaulting to 4MB
*** [upload] Error 2
Compressed 15872 bytes to 10319…

See screen shot for details

Can anyone explain what is wrong and how it can be fixed please?

If I can overcome this difficulty I will then want to take the debugger facility further, would anyone be kind in answering these supplementary questions please.

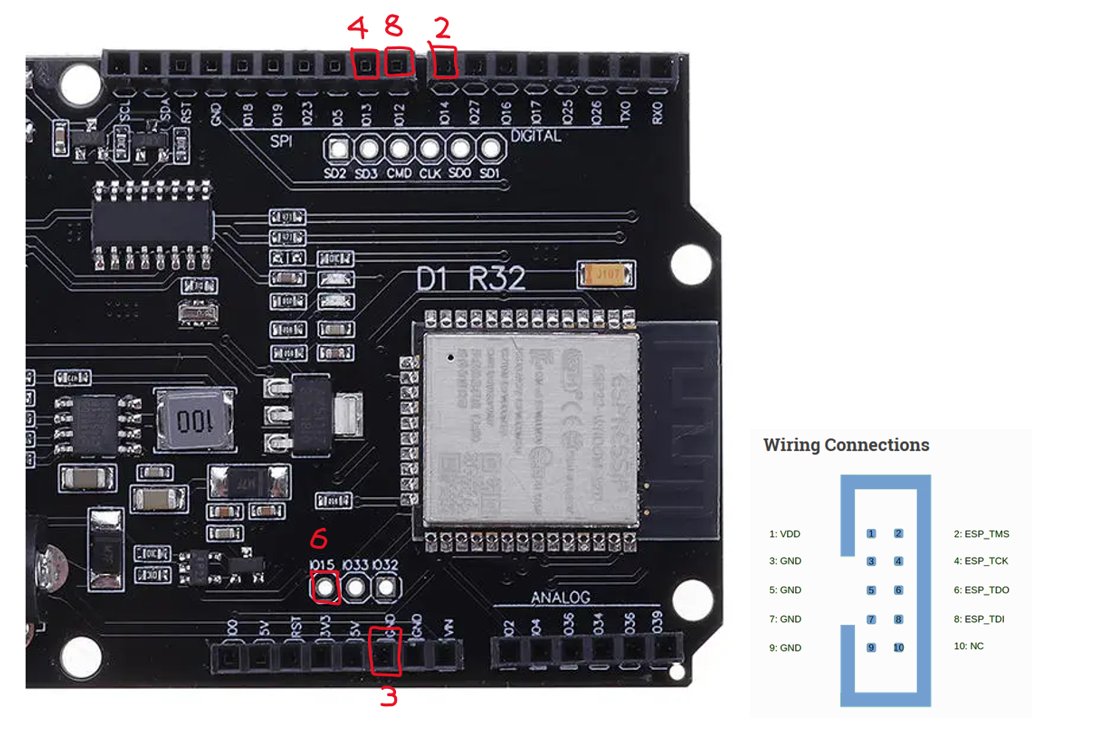
At present the debugger and target are on two separate USB cables and should work as such? I also see that the debugger has a COM port, the documentation and the IDC pinouts suggests that it should be possible to both power and program the target with the debugger, thus requiring a single USB cable, is this correct? If “yes” should the tx rx pins of the debugger be connected to the uart pins on the target ESP32? How does the esp32 know how to accept data from this UART rather than the USB vcom PORT?

Many thanks from this ESP newbie.

  • Which ESP32 board are you connecting to?
  • What is your wireup from the ESP-Prog to your board?
  • How do you power the target ESP32?
  • Do you want to upload the firmware to your board via JTAG or UART? You currently have upload_port = COM6 set so it will attempt to do a standard UART upload via the bootloader.

looks like some line is permanently pulled high or connected to the wrong pin. Pinout will surely show more.

Max, afternoon.

Thankyou for replying.

My connections are as follows (red numbers = debugger header pins).

I have tried powering the target from both the Debugger 3.3v and via USB.

Ideally I want a solution such as found on the ST Nucleo boards. Here a single USB port provides the means to act as an uploader, debugger and com port. Is the ESP-PROG capable of doing this?

Thanks

Greg

A setup similar to a Nucelo board should be possible:

Wiring

ESP-Prog WEMOS D1 R32 Remark
GND GND
5V 5V Power via 5V as the 3.3V regulator on the ESP-Prog will not be sufficient. 5V can be found near the IDC connectors.
TMS IO14 Debug signal
TCK IO13 Debug signal
TDI IO12 Debug signal
TDO IO15 Debug signal
RXD0 RX0 6-pin connector on ESP-Prog
TXD0 TX0 6-pin connector on ESP-Prog

Configuration

In platformio.ini, configure both upload and debugging to use ESP-Prog. Don’t specify an upload port.

upload_protocol = esp-prog
debug_tool = esp-prog

That way it should be possible to connect your ESP32 board through ESP-Prog only:

  • for power
  • for uploading firmware
  • for debugging
  • for serial communication

Don’t forget to use Zadig to change the USB driver for interface 0 (used for upload and debugging) to libUSB or WinUSB. Interface 1 is used for the serial connection and should use the FTDI driver.

Disclaimer

I’ve neither used a WEMOS D1 R32 board nor the serial port of the ESP-Prog before. So there might be additional pitfalls that I’m not aware of.

Manuel, thankyou for your reply.

I have partial, but not complete success…

I have managed to get the debugger working with my original configuration

Debugger using usb com26
Target using usb com 6.
No power between debugger and target.

I don’t know why it has suddenly worked, but maybe due to dodgy connections?

So the debugger works, good news, but I have observed some things that I’m concerned about.

  1. It takes ~4 seconds to load i.e. get to

Terminal will be reused by tasks, press any key to close it.

  1. A further 12 seconds to get to

Temporary breakpoint
3 a further 4 seconds

  1. Another 4 seconds for the variables to load in the variables window

Bear in mind that this is a trival piece of code, see below; “Is this performance normal”?
Also I’m experiencing abnormal CPU usage when the debugger is running. I’ve tracked this down to

Again, is this behaviour “normal”?

If you or others couild comment on these observations I’d be grateful.

I still have some way to go to getting a “nucleo” type set-up so if you or anyone else has suggestions or can help, please post.

Best regards

Greg

code under test
#include <Arduino.h>

// #defines
#define LED_BUILTIN 18
#define LED_POWER 19
#define Delay 1000 // Delay in milliseconds

// End of #defines

//Function declarations
void Blink(int n, bool m);

//End of Function declarations

//Variable declarations
int n = 0; // initialise an integer n with zero

//End of Variable declarations

// Initialisation
void setup()
{
// get the serial port working at 115200 Baud.
Serial.begin(115200);

// initialize LED digital pin as an output.
pinMode(LED_BUILTIN, OUTPUT);
pinMode(LED_POWER, OUTPUT);
digitalWrite(LED_POWER, 1);
}

// End of Initialisation

// Main Loop
void loop()
{
// Calculate n mod 2; and test if the answer is 0 or 1 i.e. test for odd or even number
if (n%2 == 0){
// n is EVEN, pass n to Blink for printing and turn LED off.
Blink(n, LOW);
}
else{
// n is ODD, pass n to Blink for printing and turn LED on.
Blink(n, HIGH);
}

n=n+1; // incremwent n
delay(Delay); // wait for DELAY

}

// End of Main Loop

//Functions

void Blink(int n, bool m){
Serial.print(n,DEC); // print as an ASCII-encoded decimal
Serial.print(“\t”); // prints a tab
Serial.println(); // prints a new line
digitalWrite(LED_BUILTIN, m);
}

The debugger does not use a serial connection. In fact, if endpoint 0 of ESP-Prog was configured as a virtual COM port, the debugger wouldn’t work at all. Why do you think the debugger is using COM26?

Does this refer to the serial communication for monitoring the output? Or what do you mean by that?

I have no idea why the debugger is so slow. Your code or code size shouldn’t have anything to do with it. It should always take the same time to set a breakpoint.

Can you have a look at the DEBUG CONSOLE (next to PROBLEMS, OUTPUT and TERMINAL view). Can you post the output and indicate where it’s usually stuck?

Manuel Hi.

In my previous post I was using the term “USB Serial Port (COM26)” as an observed I.D. so as to distinguish it between the debugger and the target board, that was enumerating to"USB Serial Port (COM6)". I fully appreciate that the FT2232HL exposes two ports that can be configured for a variety of serial and parallel interfaces, and that when working in “JTAG mode” it will not be a com port. This leads nicely into the ext issue, but before that “Yes”, usb com 6 refers to the uart that the program uses to send data.

As you know I want to have the esp-prog provide programming, debugging and communications over a single USB. So far I can confirm programming and debugging. So how do I get access to the com stream, i.e. the data transmitted by the program, via the JTAG port?

I’m aware of the fact that the FT2232HL exposes two ports. If I follow the installation proceedure and apply Zadig to USB Serial Convertor A, when I connect the debugger and it has enimerated, three “devices” are installed as per the screen shot.

As you can see from the device tree, the debugger is now exposing COM28, previously COM28. My program (that I can debug via break-points etc.) transmits a count variable over UART each time a LED toggles. I’ve tried confirm transmissions by monitoring com28 using an external terminal program but no data is received. How do I expose the serial data that the program is sending through the JTAG port and view it in a third party terminal?

Thanks, Greg

PS

With respect to the performance issues, my system does not “hang” it just takes an unusually long time to initiate the debugger and use the debug features (eg loop to break point and update a variable seems to takes >5 seconds); this is poor in comparison with other debuggers I’ve used. I’m simply enquiring if the times I’ve quoted here and in the previous message, are typical?

Also I mentioned the very heavy cpu usage (25%!!)…sufficient for the laptop fan to kick in and run as long as the debugger is running plus time to cool down when debugger has stopped. This is clearly debugger related openocd(32). Have you or anyone else notice very high cpu usage during debugging?

I’ve just realized that my wiring table was wrong. RX and TX need to be crossed, of course. Could that be the problem?

As it turns out, they don’t need to be crossed. I’ve updated the table again.

Very surprising labelling…

Manual, evening.

I have the system working, many thanks for your help. “Yes” it is stange to feed a Tx into a Tx, Rx into a Rx. I suggest that Espressif alter their silk screen and their schematic!

You have been most helpful.
I’ll summarise what we’ve done, feel free to add or comment.

1 The original Fatal error!

I can only imagine that this must have been due to a poor connection. I’m using single jumper wires not an IDC connector; that said I test continuity especially when starting with a new technology.

2 The installation process

Works as written but is brief with respect to things that don’t work. I will aim to document some of these points after a period of familiarisation with the debugger.

3 General quality of description

Good, but it lacks a high level description of what is going on; again I will make some notes when I’ve gained more experience.

4 ESP-PROG Performance.

4a: Seems to do the basic things a debugger should, albeit slower than other debuggers I have used, eg ST-link on the Nucleo boards. Again I will explore the debugger capabilities in the comming weeks.

4b: Not happy with the excessive (25%) cpu usage when debugging. I’d be keen to learn if others have observed this “heavy” usage and keener still to learn if someone has had this problem and fixed it.

5 Miscellaneous

In the Platformio Interface there is an icon, see below, that when hovered over says run debugger. This button does not run the debugger, rather it OPENS the debugger, RUNNING is controlled by pressing the green forward triangle and allows the user to start debugging the program to the right of the triangle. I like what you’re achieving with Platformio, and correct naming would both enhance and ease the user experience, just a suggestion :slightly_smiling_face:.

Annotation 2020-05-21 204657

Again, many thanks for your time.

Greg

Regarding 4b, you better start a new topic. Most members won’t spot it in the middle of this long thread.

Hi just saw this thread. Have you tried to connect also RTS and DTR from the serial port of the ESP-Prog to the rest logic. This controls the rest of the board and some timing during reset.

regards
wolfram

@wolfram My understanding is that everything is working fine except the debugger is very slow.

On development boards, RTS and DTR are used to reset the device and put it into serial upload mode. That’s needed if the firmware is uploaded via the virtual serial connection. However in the above setup, the firmware is uploaded via JTAG. So it’s not needed.

Wolfram, hi.

Thank you for your suggestion.

As manuelbl points out I now have the esp-idf debugger working. In my set-up the RTS and DTR are unecessary, but thanks again.

Regards Greg