Cannot run builtin debugger on esp32-s3 board

Hello guys,

I cannot manage to run debugger on the microcontroller I’m using. The microcontroller is based on esp32-s3, in particular it is this one: GitHub - Xinyuan-LilyGO/T-RGB. I start to think that maybe its not even possible on that particular board.

I’m using VSCode. I followed this guide to install the right drivers for USB to access the JTAG interface: Configure ESP32-S3 Built-in JTAG Interface - ESP32-S3 - — ESP-IDF Programming Guide latest documentation. It landed on COM6 and it is also the port for uploading. It is called “USB JTAG/serial debug unit (Interface 0)”. Then I updated the platformio.ini with this line:
debug_tool = esp-builtin
Then when running “PIO Debug” it fails with the following messages:

Error: libusb_open() failed with LIBUSB_ERROR_NOT_SUPPORTED
Error: libusb_open() failed with LIBUSB_ERROR_NOT_FOUND
Error: esp_usb_jtag: could not find or open device!

This looks like the access through USB port is not working, so I added to configuration file this line:
debug_port = COM6
It looked more promissing, as after the build (before upload) it taken some time before it responded. However, after about a minute it ended with this error message:

PlatformIO: debug_tool = esp-builtin
PlatformIO: Initializing remote target...
Ignoring packet error, continuing...
warning: unrecognized item "timeout" in "qSupported" response
Ignoring packet error, continuing...
.pioinit:11: Error in sourced command file:
Remote replied unexpectedly to 'vMustReplyEmpty': timeout

Do you guys see some red flag what I can be doing wrong? Or do you see why the builtin debugger in this case cannot work in principle?

I haven’t tried it myself yet, but have you read this post and followed the instructions in it?

yes it works, VSCode/Platformio sometimes is a litle bit buggy, but most of times the debugger works well.

Thank you (and Eduardo) for trying to help :+1:
The step by step guideline is pretty good. I did follow it, but ended at step 4.
I see something strange locally which very well can be behind the whole problem. When setting the ports with Zadig tool, I end up with this:


The “USB-JTAG/serial debug unit(Interface 0)” on COM6 seems to be correct, exactly as described in the guideline. But according to the guideline I should see something like “USB-Enhanced-SERIAL CH323” on a different COM. And this is what I don’t see, even though I completed the install with Zadig on “interface 2” and target “WinUSB” before.
So consequently I had to use the same COM for both upload and monitor port like this:

debug_tool = esp-builtin
upload_port = COM6
monitor_port = COM6
debug_init_break = break setup
build_type = debug

… but that probably does not make much sense. It ended up with the usual:

Error: libusb_open() failed with LIBUSB_ERROR_NOT_SUPPORTED
Error: libusb_open() failed with LIBUSB_ERROR_NOT_FOUND
Error: esp_usb_jtag: could not find or open device!

Not near my computer but iirc, you also need to do some zadig setup for serial port 0.

Thank you for the answer, Zapta! When you say serial port 0, you mean UART0, right? I do use Zadig tool (I followed the above reference) - from what I understand it can map the UART port to COM. But while in the reference Eduardo managed to map 2 COM ports, I managed only one - I’m missing the “USB-Enhanced-SERIAL CH323”.

@vladimir.nejedly

The errors you listed are what I get before I do the zadig setting, or when the zadiq setting is lost for some reason.

Error: libusb_open() failed with LIBUSB_ERROR_NOT_SUPPORTED
Error: libusb_open() failed with LIBUSB_ERROR_NOT_FOUND

Here is what I see on my computer (after zagid setting). Be careful with the zadig settings because I don’t know of a simple way to undo them. I use Acronis Try & Decide for risky stuff.

Windows device manager, before I plug in the debugger:
image

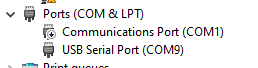
Windows device manager, after I plug in the debugger (only one port is added):
image

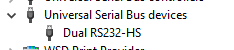
And I also see this:
image

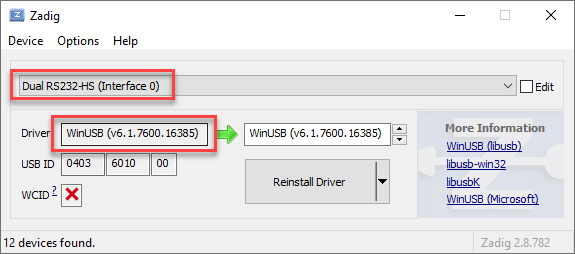
In Zadig, interface 0 looks like this:
image

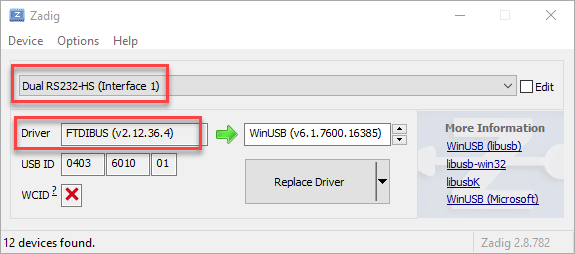
And interface 1 looks like this:
image

This is my platformio.ini. It uses the standard (non debugger related) USB/Serial port to run in release mode and the debugger to run in debug mode.

[env:esp32dev]
platform = espressif32@6.1.0
board = esp32dev
framework = espidf
monitor_speed = 115200
debug_tool=esp-prog

You may find more info in these links (which I bookmarked in my platformio.ini)

Finally got the debugger working! You were right, Zapta, the problem was related to usb driver and that it could be resolved by Zadig tool.
I found answer to my particular problem in this forum: libusb_get_string_descriptor_ascii() returns always LIBUSB_ERROR_NOT_FOUND -- libusb0.sys only · Issue #761 · libusb/libusb · GitHub
And the problem was that for the debugging JTAG interface, that is “Interface 2” I was using “libusb0” driver. When starting to use “libusbK”, the debugger started to work. This was the relevant text from the linked forum:
{{
Take note it is not recommended to use libusb0.sys with libusb Windows. It is mentioned in the wiki.
Windows · libusb/libusb Wiki · GitHub
}}
Well, that was hard… :wink: