I have just received my Chinese JLINK clone.
Added debug_tool = jlink
The package downloaded successfully, I have installed the driver, started debugging, I get a warning and an error, and nothing works::
Target interface speed: 4000kHz
Target endian: little
Connecting to J-Link…
Reading symbols from d:\PIO\Duett\DEV.pio\build\due\firmware.elf… undefinedC:\Users\cspalos.platformio\packages\toolchain-gccarmnoneeabi\bin\arm-none-eabi-gdb.exe: warning: Couldn’t determine a path for the index cache directory.
PlatformIO Unified Debugger → Redirecting...
PlatformIO: debug_tool = jlink
PlatformIO: Initializing remote target… .pioinit:14: Error in sourced command file: :2331: Nem hozhat� l�tre kapcsolat, mert a c�lsz�m�t�g�p m�r visszautas�totta a kapcsolatot.
The last sentence is in Hungarian and means something like: No connection could be established because the target computer refused the connection.
I have also tried with the official Segger GDB server, it also could not connect…
Ok if it doesn’t even work with the official tools something more fundamental must be wrong. What’s the wiring between the JLink and the Due? Which exact JLink device do you have?
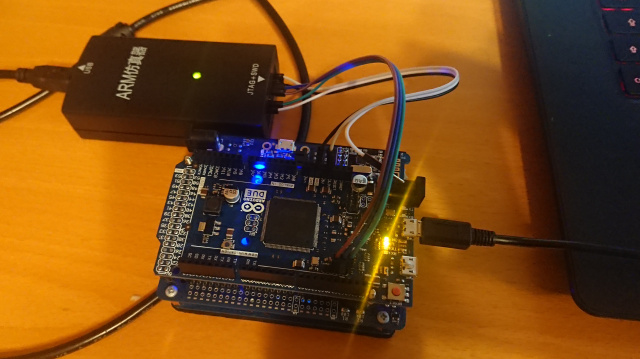
Wiring is:
Pin1 VTref to 3V3
Pin4 GND to GND
Pin19 5V to 5V
Pin7 SWDIO to SWDIO
Pin9 SWCLK to SWCLK
Pin15 RESET to RESET
These last three all connected to the 0.1" pins next to Pin12 and Pin13 of the Arduino Due.
What is unclear for me:
I am still using USB programming port for upload. Shall also USB be connected so that the debug information can be uploaded with the image?
How can I tell to my probe that I want to use SWD and not JTAG (I don’t have the right wire for JTAG yet)
Is it a good idea to allow a firmware update on the clone? It seemed to update correctly, but when I try to debug, often a firmware update popup shows up for a second again.
What is the word undefined in the output?
undefinedSEGGER J-Link GDB Server V6.52 Command Line Version
JLinkARM.dll V6.52 (DLL compiled Sep 27 2019 17:50:11)
Command line: -singlerun -if SWD -select USB -device ATSAM3X8E -port 2331
-----GDB Server start settings-----
GDBInit file: none
GDB Server Listening port: 2331
SWO raw output listening port: 2332
Terminal I/O port: 2333
Accept remote connection: localhost only
Generate logfile: off
Verify download: off
Init regs on start: off
Silent mode: off
Single run mode: on
Target connection timeout: 0 ms
------J-Link related settings------
J-Link Host interface: USB
J-Link script: none
J-Link settings file: none
------Target related settings------
Target device: ATSAM3X8E
Target interface: SWD
Target interface speed: 4000kHz
Target endian: little
Connecting to J-Link…
Reading symbols from d:\PIO\Duett\DEV.pio\build\due\firmware.elf… undefinedC:\Users\cspalos.platformio\packages\toolchain-gccarmnoneeabi\bin\arm-none-eabi-gdb.exe: warning: Couldn’t determine a path for the index cache directory.
PlatformIO Unified Debugger → Redirecting...
PlatformIO: debug_tool = jlink
PlatformIO: Initializing remote target… .pioinit:14: Error in sourced command file: :2331: Nem hozhat� l�tre kapcsolat, mert a c�lsz�m�t�g�p m�r visszautas�totta a kapcsolatot.
Yes, I have installed the drivers. But it did not work the advertised way: c:\Users\Csaba.platformio\packages\tool-jlink\USBDriver\InstDrivers.exe did not work, it stopped after the UAC. I had to start c:\Users\Csaba.platformio\packages\tool-jlink\USBDriver\x64\dpinst_x64.exe directly.
Now I have tried on a different computer, exactly the same result.
I have changed the windows language to English. The error message is>
PlatformIO: Initializing remote target…
Could not connect to J-Link.
Please check power, connection and settings…pioinit:16: Error in sourced command file:
:2331: No connection could be made because the target machine actively refused it.
In the current setup I do use the 5V from the probe to power the target board. I have just tried the other way, powering through the programming port without connecting 5V, did not help. The board itself is working in both setups, The LED on the probe is on, but cannot connect.
I have just tried to disconnect RESET, did not change.
Sometimes I get a popup to update the firmware. If I let it update, seems to update well, and the next time the popup does not appear.
Is this setting correct?:
Target connection timeout: 0 ms
Where can I increase it?
The “undefined” words disappeared. (It is a different PC).
This is the setup without 5V connected, board powered over USB programming port.
It does see the hardware and offers a Firmware update. It seems to install the firmware update, and reports that the update was successful, although it could not connect the hardware afterward. The next time there is no such update popup.
But the GDB connection is not sucessful:
SEGGER J-Link GDB Server V6.54c Command Line Version
JLinkARM.dll V6.54c (DLL compiled Nov 7 2019 17:01:02)
-----GDB Server start settings-----
GDBInit file: none
GDB Server Listening port: 2331
SWO raw output listening port: 2332
Terminal I/O port: 2333
Accept remote connection: localhost only
Generate logfile: off
Verify download: off
Init regs on start: off
Silent mode: off
Single run mode: off
Target connection timeout: 0 ms
------J-Link related settings------
J-Link Host interface: USB
J-Link script: none
J-Link settings file: none
------Target related settings------
Target device: Unspecified
Target interface: JTAG
Target interface speed: 4000kHz
Target endian: little
Connecting to J-Link…
Connecting to J-Link failed. Connected correctly?
GDBServer will be closed…
Shutting down…
Could not connect to J-Link.
Please check power, connection and settings.
It’s rather unlikely that you have bricked your J-Link.
Currently, the J-Link software cannot talk to the J-Link debug probe. So conduct the following test without the Arduino connected.
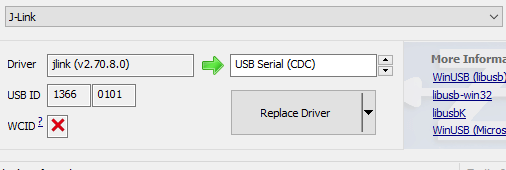
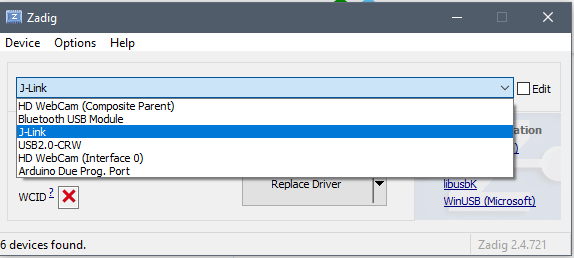
Download and install Zadig. It’s a software for configuring USB drivers.
In Zadig, check Options > List All Devices.
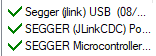
You should now see two interfaces related to J-Link: CDC (Interface 0) and BULK Interface (Interface 2). Do they have the JLinkCDC and jlink driver installed?
ERROR: Failed to connect.
Could not establish a connection to the J-Link.
But it makes a difference whether the probe is plugged in or not: when plugged in, I get a line “- Connecting via USB to J-Link device 0” and a notification about a firmware update, else I don’t.
I just mean that the probe is not completely dead, the J-Flash software does recognize the presence of the probe when plugged in, just cannot connect to it.