Hello,
I have the following error messages when I try to debug:
Reading symbols from c:/Users/snoof/Documents/PlatformIO/Projects/181004-223214-arduino-wifiscan/.pioenvs/esp wrover kit/firmware.elf…
done.
PlatformIO Unified Debugger > Redirecting...
PlatformIO: Initializing remote target…
Open On-Chip Debugger 0.10.0-dev (2018-06-04-09:51)
Licensed under GNU GPL v2
For bug reports, read OpenOCD: Bug Reporting
none separate
adapter speed: 20000 kHz
esp32 interrupt mask on
force hard breakpoints
Info : tcl server disabled
Info : telnet server disabled
Info : ftdi: if you experience problems at higher adapter clocks, try the command “ftdi_tdo_sample_edge falling”
Info : clock speed 20000 kHz
Error: JTAG scan chain interrogation failed: all ones
Error: Check JTAG interface, timings, target power, etc.
Error: Trying to use configured scan chain anyway…
Error: esp32.cpu0: IR capture error; saw 0x1f not 0x01
Warn : Bypassing JTAG setup events due to errors
I have carefully followed the instructions here:
But it is not working.
Do you have an idea how to find what the issue is?
it is a Wrover kit.
The thing is that I’ve tried this command and I have the same error message…
openocd-esp32\bin>openocd.exe -s …/share/openocd/scripts -f interface/ftdi/esp32_devkitj_v1.cfg -f board/esp-wroom-32.cfg
and I have the same error.
I have done the same thing than in this tuto, the Debugging an ESP32 Wrover Kit part:
Is it possible that something is not right with my board?
I’ve been trying to get this damn debugger to work for two weeks now, even spending money to buy me PIO Plus.
In the meantime, I’ve probably worked through 5 or 6 tutorials and also that of botofancalin. All without success. I just can’t get the ESP32-WROVER-KIT to work with this shit debugger.
The error message I get is exactly the same as above. I can’t get any further. I’ve checked all connections on the board and they’re working fine.
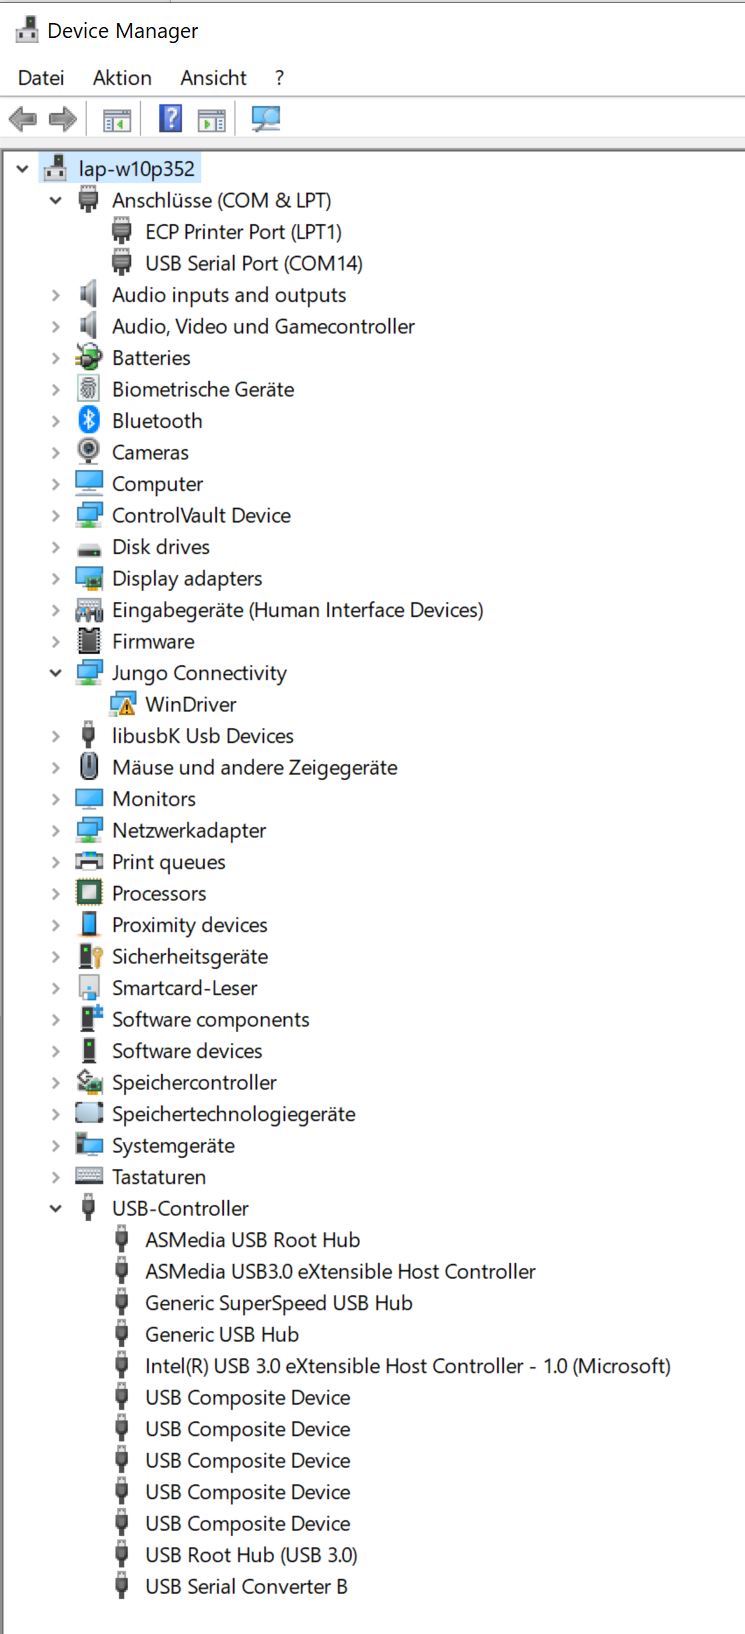
What OS do you have? What platformio.ini do you use? Are you setting up the FTDI chip correctly using zadig? Do you have all jumpers set correctly for JTAG communication?
problem solved!
on the ESP32 Wrover kit the jtag pins are also used by the SD card. To be able to debug I need to remove all SD card code, libraries and the SD card itself from the slot.
I was experiencing the same problem. Turning down SPI Flash Speed to 20Mhz did the job for me. Surprised it didn’t say that anywhere in the documentation.