Intro
I’ve seen several questions pop about this. Some people might already know this and find this boring, some others won’t. This tutorial is aimed at beginners using PlatformIO and wanting to know how to debug their firmwares. It is only assumed that you know how to work with your shell / bash / cmd.exe. So here’s a tutorial on setting up debugging STM32 & ESP32 targets in IDEs.
I’m using Eclipse and CLion as examples of IDEs, though the general idea for other IDEs is the same.
This tutorial only requires a hardware debug probe and free software to work. It works on all OSes.
Needed hardware
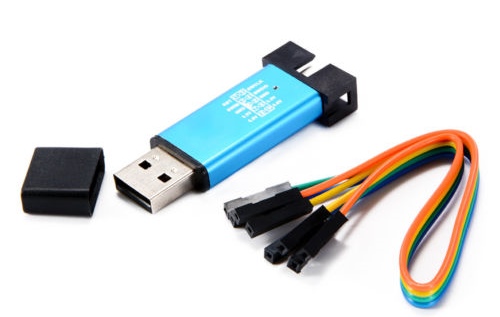
In general, many ARM chips can be debugged using the SWD (single-wire-debug) protocol. You can cheaply obtain a clone of ST-Link V2 chip, which can speak SWD and SWIM (for 8-bit STM8 chips). These cost around 2€ to 5€ on ebay at the time of writing.
Other chips may require a JTAG debugger or even a different one (debugWire for Atmel chips).
Some boards even have the debug-probe on-board. This is the case with e.g. STM32 Nucleo or Disco boards, which have a ST-Link V2 on-board. The ESP32-Wrover kit also has a special 2-channel FTDI chip. One of these channels will act as a JTAG debugger that we can use.
General idea
All you need to live-debug a target is:
- the program you’re debugging, preferably with debug symbols
- a hardware debug-probe connected to your target chip
- an interface for the IDE to interact with the debugger, for example a gdbserver
The first point is taken care of by PlatformIO. In your project folder, it generates the firmware.elf files under the hidden folder .pioenvs/<your-board-target>/. You can tell GCC to add debug symbols for GDB by adding -g3 or -ggdb as a build flag, e.g. by adding the line
build_flags = -ggdb
to your platformio.ini.
For the second point, you’ll need to either have to have a debug-probe yourself or already one on the board. I’ll go over an example wireup with an external debugger (ST-Link V2) later.
For the third part, I’ll be utilizing the “OpenOCD” (Open On-Chip-Debugger) tool. This tool will be connecting to our debug probe and the target chip and opening a GDB server. The GDB server will allow a gdb client (e.g., the arm-none-eabi-gdb program) to connect to chip and send debugging commands. More details on this later.
There are also other programs capable of opening a GDB server, e.g. st-util for STM32 chips or avarice for Atmel AVR chips (you can debug a Arduino Uno/Nano with this).
In short:
+--------+      +-------+      +-------------------+     +------------------------+     +-------+
| Target |      | Debug |      |Debugger Interface |     |Debugger Client         |     |  IDE  |
| chip   <------> probe <------>(e.g. OpenOCD)     <----->(e.g. arm-none-eabi-gdb)<----->       |
+--------+      +-------+      +-------------------+     +------------------------+     +-------+
Installing the GDB plugin in Eclipse
Our IDE must be able to use a GDB executable to debug the program. In Eclipse we must first install the plugin. Go to Help -> Install New Software, select “All sites” and type “GDB” in the search bar.
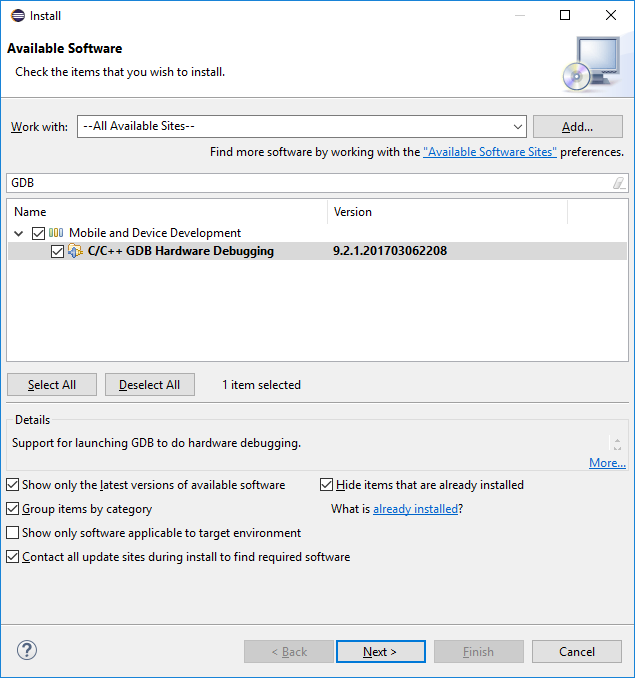
Go through the installation process and restart the IDE. You now have “GDB Hardware Debugging” available in the “Debug Configurations” which we will configure later.
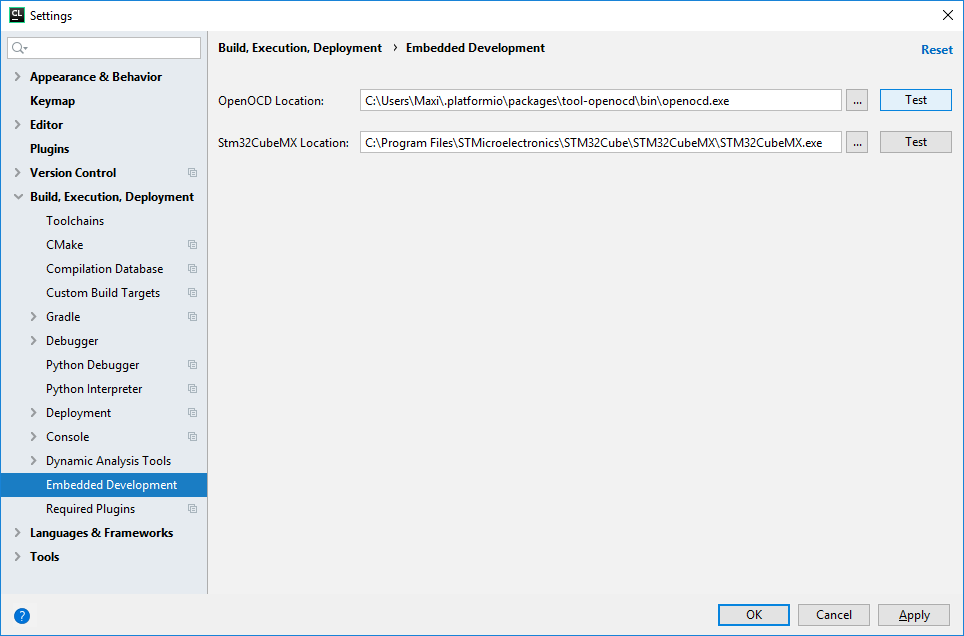
Installing and Understanding OpenOCD
You will also need to be able to start up OpenOCD. You can download a copy of the program for windows here. On Linux, use your package manager to install it, e.g. by typing sudo apt install openocd. On MacOS, use these releases.
Whatever OS you’re using, you should add openocd to your PATH so that you can call it from the shell (or cmd.exe).
Let’s look at openocd -h to see what it can do:
C:\Users\Maxi\Downloads\openocd-0.10.0\bin>openocd -h
Open On-Chip Debugger 0.10.0 (2017-08-21) [https://github.com/sysprogs/openocd]
Licensed under GNU GPL v2
For bug reports, read
        http://openocd.org/doc/doxygen/bugs.html
Open On-Chip Debugger
Licensed under GNU GPL v2
--help       | -h       display this help
--version    | -v       display OpenOCD version
--file       | -f       use configuration file <name>
--search     | -s       dir to search for config files and scripts
--debug      | -d       set debug level to 3
             | -d<n>    set debug level to <level>
--log_output | -l       redirect log output to file <name>
--command    | -c       run <command>
In general you give openocd a list of configuration files for your target via the -f switches. All available configurations / debug targets can be seen in the share\openocd\scripts folder. Debugging-probes will be in interface and target chips will be in target or board. Here is a small excerpt.
├───board
[...]
│       stm32f0discovery.cfg
│       stm32f334discovery.cfg
│       stm32f3discovery.cfg
│       stm32f429disc1.cfg
[...]
│       st_nucleo_f0.cfg
│       st_nucleo_f103rb.cfg
│       st_nucleo_f3.cfg
│       st_nucleo_f4.cfg
│       st_nucleo_f7.cfg
│       st_nucleo_l073rz.cfg
│       st_nucleo_l1.cfg
│       st_nucleo_l476rg.cfg
├───interface
│   │   buspirate.cfg
[...]
│   │   stlink-v2.cfg
[...]
├───target
[...]
│       stm32f0x.cfg
│       stm32f0x_stlink.cfg
│       stm32f1x.cfg
For example, if we wish to debug a Nucleo STM32L152 board (on-board debugger), we’d use openocd -f board/st_nucleo_l1.cfg.
OpenOCD opens a GDB server on localhost:3333 (here).
Using the right GDB client
We will be debugging XTensa32 and ARM targets for which we need a GDB client. Fortunetly, if you have already compiled a program for these platforms, you already have the toolchain-X package which contains the needed gdb client.
You will need to go to your PlatformIO installation directory.
- Windows:
C:\Users\<Username>\.platformio - Linux and Mac:
.platformioin yourhomedirectory. (e.g.~/.platformio)
There, go to packages/toolchain-gccarmnoneeabi/bin. You should see a arm-none-eabi-gdb.exe file or similiar there. Remember the path to this executable for later.
For the ESP32, the GDB can be found at packages/toolchain-xtensa32/bin/xtensa-esp32-elf-gdb.
Debugging a BluePill board (STM32F103C8)
We first set up a demo project. Create a new folder “bluepill_debugging” and execute pio init -b genericSTM32F103C8 --ide=eclipse in it. Open the platformio.ini and add build_flags = -ggdb as a new line to it. As a main.cpp, add
#include <Arduino.h>

int pin = PC13;

void setup() {
	pinMode(pin, OUTPUT);
}

void loop() {
	digitalWrite(pin, HIGH);
	delay(500);
	digitalWrite(pin, LOW);
	delay(500);
}
We will use a ST-Link V2 to both upload the program and debug it. Connect a ST-Link V2 probe to it. You’ll need to connect 3.3V, GND, SWIO, and SWCLK from the ST-Link V2 to the 4-pin header at the top of the blue pill board. The pinouts are printed on the ST-Link V2 probe. For the Bluepill board, the pinout can be seen here. It should now look like in this video at the 3 second mark.
Using Eclipse
Import the project into a Eclipse and execute the PlatformIO: Upload target. It should compile and upload the code using the connected ST-Link V2 probe. This should make the red debug LED on the board flash every 500ms.
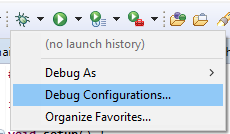
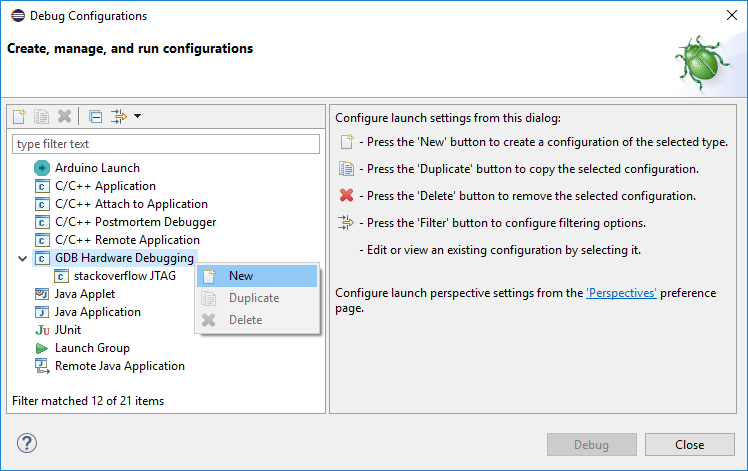
Next, go Debug -> Debug Configurations.... Add a new configuration under the “GDB Hardware Debugging Tab”.
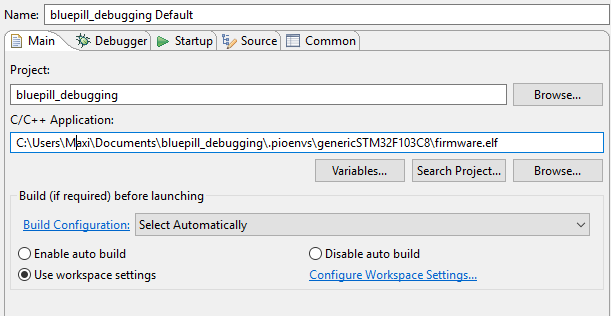
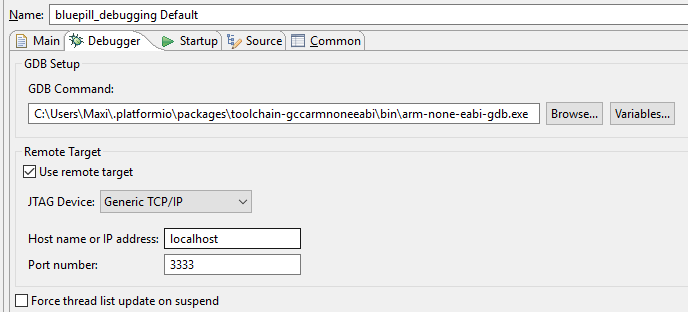
Here we need to configure the following stuff:
- Main: Set “C/C++ Application” to the path of your
firmware.elf - Debugger: Set “GDB” to the path to your
arm-none-eabi-gdbexecutable - Set the connection details to host name
localhostand port number3333(openocd uses this) - Startup: optionally write “setup” in “Set breakpoint at” to automatically stop there
Click Apply and set a breakpoint at the first delay statement.
Start openocd from a terminal using the command openocd.exe -f interface\stlink-v2.cfg -f target\stm32f1x.cfg. This tells OpenOCD to use the ST-Link V2 probe to debug a STM32F1X target (we have STM32F103C8 chip). The output should look like
C:\Users\Maxi\Downloads\openocd-0.10.0\share\openocd\scripts>openocd.exe -f interface\stlink-v2.cfg -f target\stm32f1x.cfg
Open On-Chip Debugger 0.10.0-dev-ga859564 (2017-07-24-16:18)
[...]
Info : STLINK v2 JTAG v17 API v2 SWIM v4 VID 0x0483 PID 0x3748
Info : using stlink api v2
Info : Target voltage: 3.253616
Info : stm32f1x.cpu: hardware has 6 breakpoints, 4 watchpoints
Leave the terminal window open, go to Debug -> Debug Configurations... again, select the previosly setup configuration and hit “debug”. The target should now be stopped at address 0x0. Press “Play” again to trigger breaking at the previously set-up breakpoint.
Now you should see this:
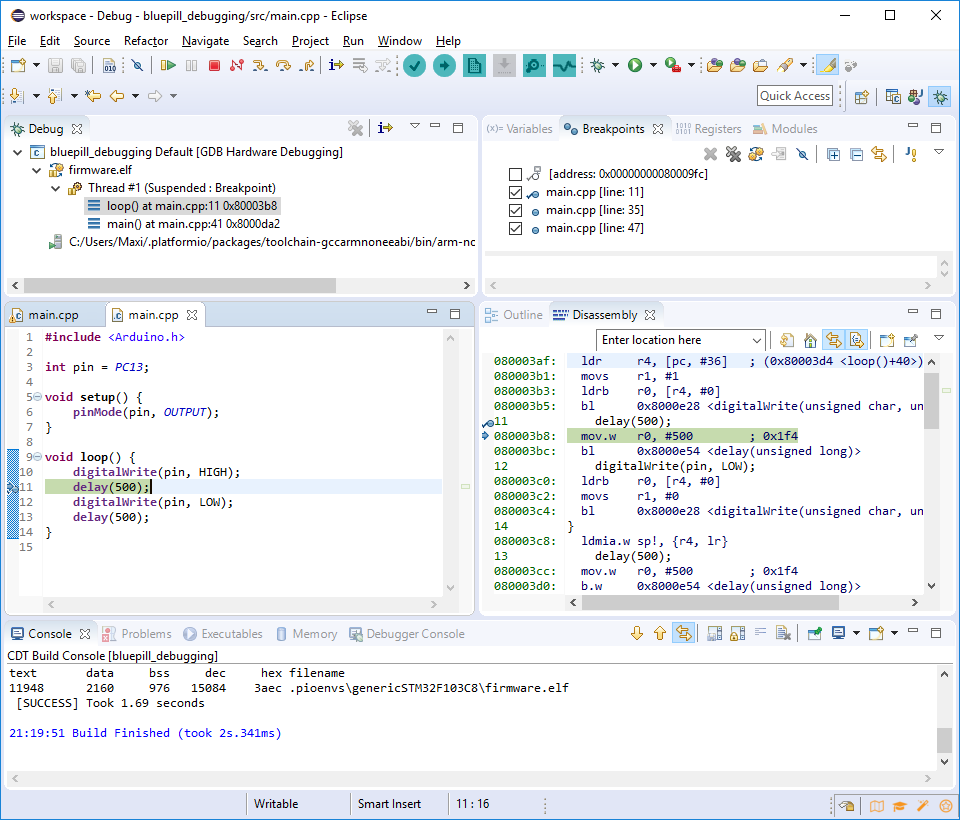
Tada! We can now do line-stepping, watch variables, watch CPU registers, set other breakpoints, et cetera. Debugging as usual.
Using CLion
Re-generate project files for CLion with pio init --ide=clion and open the project in CLion. You should be able to build and flash the project onto the MCU.
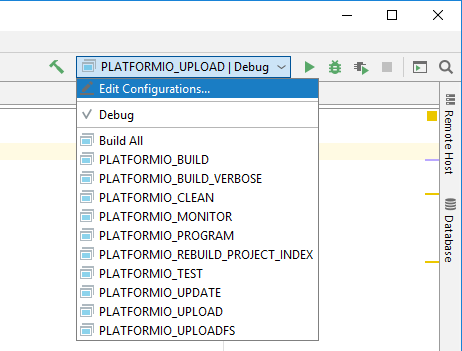
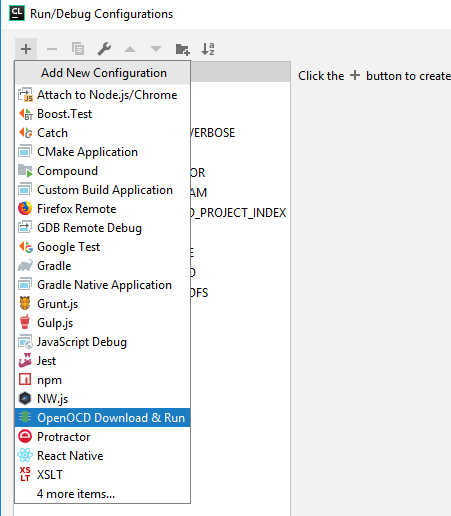
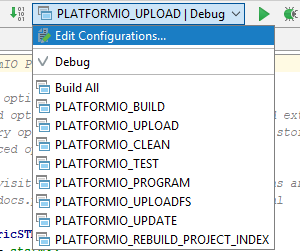
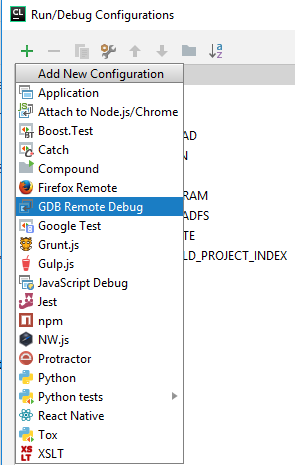
Edit the configurations by clicking on the build target list and selecting Edit Configurations.... There, click on the + icon and add a new GDB Remote Debug configuration.
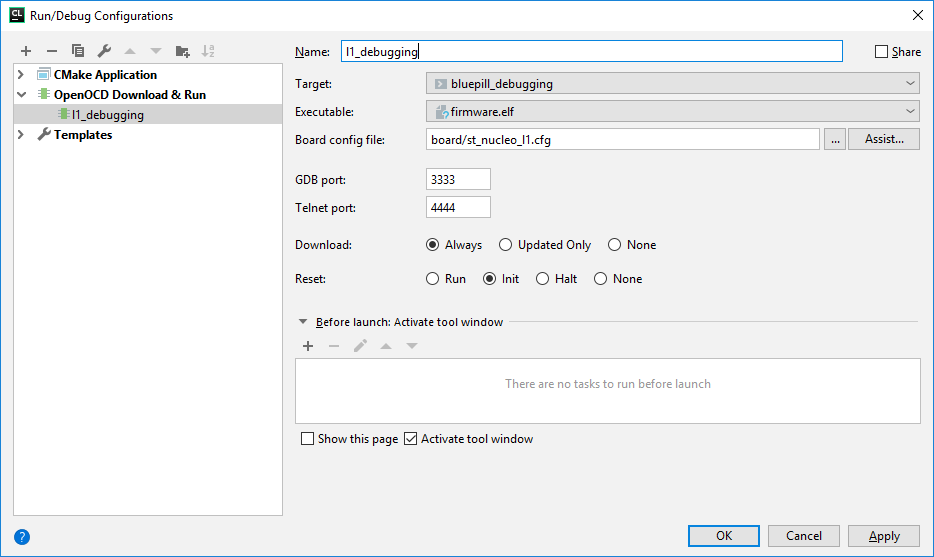
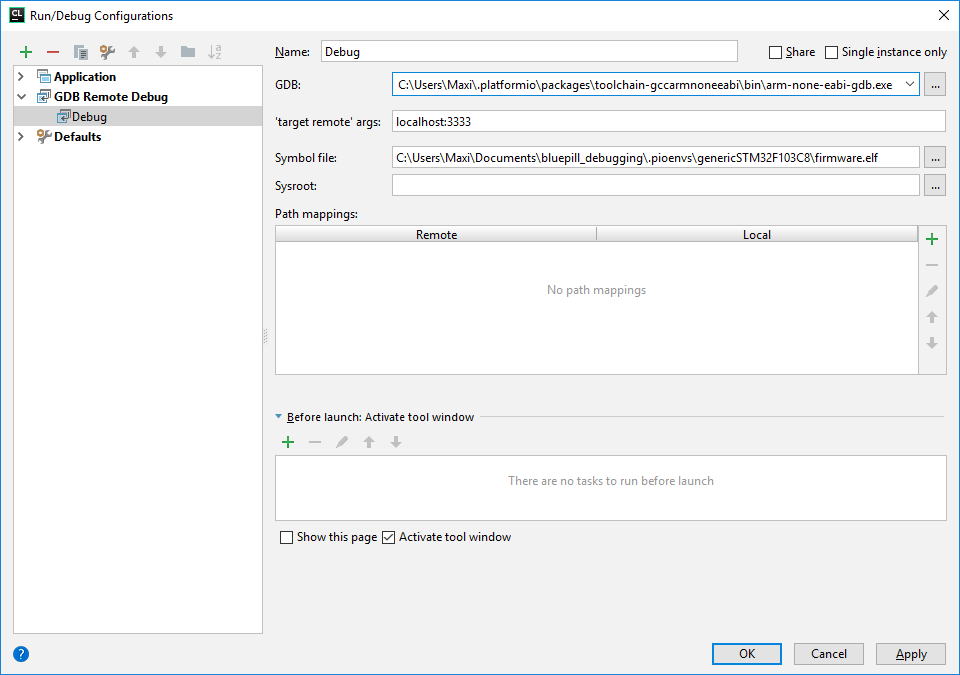
We then need to tell CLion the same things we told Eclipse.
- GDB: Select “custom GDB executable”, then insert the path to your
arm-none-eabi-gdbthere - ‘target-remote-args’: Set this to
localhost:3333 - Symbol file: Insert the path to your
firmware.elfthere
After uploading the firmware and seeing the program run, start openocd the same way as in the Eclipse section.
Then, select the new debug configuration (lowest entry), set a breakpoint in the loop and press the “Debug” button.
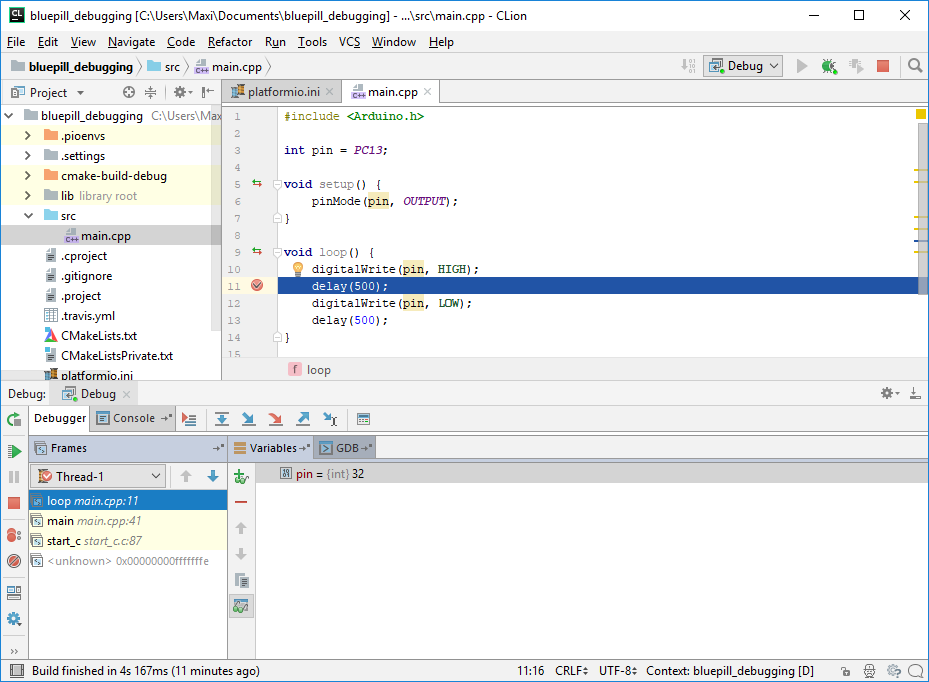
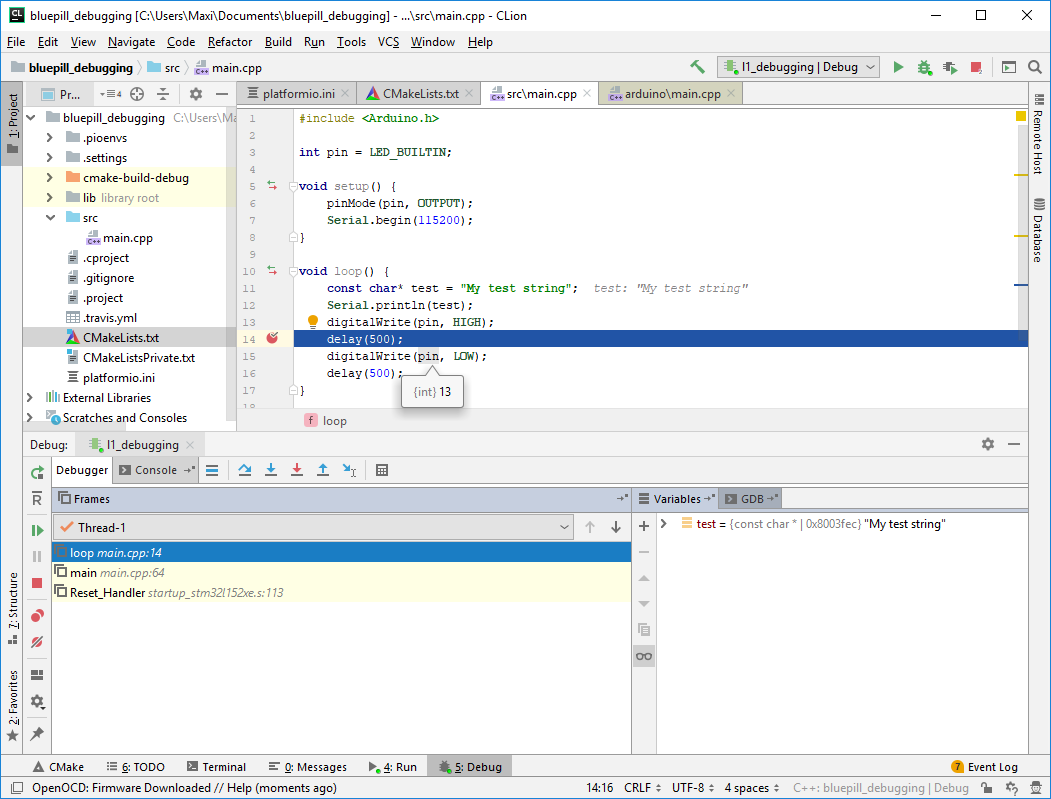
The breakpoint was hit and I added a variable watchpoint for pin, which works as expected. We can again do debugging as usual.
Debugging a Nucleo L152RE board (STM32L152RE)
Using the previous example we can derive how to debug other boards. Basically, we just need to
- adjust the used
firmware.elf - find the right configuration file for
openocd - use the right
gdbfor the target architecture
In the case of the Nucleo L152RE, we can see the file st_nucleo_l1.cfg in the boards folder. So we will use openocd -f board/st_nucleo_l1.cfg as our openocd command. This board has a built-in debugger, so we just need to connect the board to our computer.
I’ve created a new project named nucleo_l1_debugging and used pio init -b nucleo_l152re --ide=eclipse to initialize and generate project files. Again add build_flags = -ggdb to the platformio.ini. I’ll be using the mbed framework to program it.
main.cpp:
#include <mbed.h>

DigitalOut led(LED1);

int main() {
	while(1) {
		led = 0;
		wait_ms(500);
		led = 1;
		wait_ms(500);
	}
	return 0;
}
Set up Eclipse a new debug configuration the same way as in the previos section with the correct paths and set a breakpoint before wait_ms. Start openocd with the command given above. Then execute the new debug configuration.

Debugging an ESP32 Wrover Kit
We can also debug XTensa32 targets. On the ESP-WROVER-Kit, we first have to set up the FTDI chip as described in https://esp-idf.readthedocs.io/en/latest/api-guides/jtag-debugging/configure-wrover.html. Reading JTAG Debugging - ESP32 - — ESP-IDF Programming Guide latest documentation is also helpful.
We need to use a specially compiled version of openocd which has support for the ESP32. A download link for a portable openocd is given here. Extract it to some path in your computer.
We can create a simple Arduino sketch for the ESP32. Create a new folder and execute pio init -b esp-wrover-kit --ide=eclipse. Add as main.cpp:
#include <Arduino.h>

int pin = 2; //IO2 has a LED connected to it on the wrover board

void setup() {
	pinMode(pin, OUTPUT);
}

void loop() {
	digitalWrite(pin, HIGH);
	delay(500);
	digitalWrite(pin, LOW);
	delay(500);
}
Compile and upload the firmware to the board. The green LED on the board should blink every 500ms.
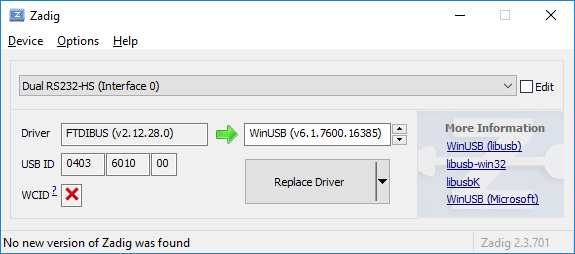
On Windows, use the zadig.exe tool to replace the driver for Dual RS232-HS (Interface 0) as instructed in the link given above. For other OSes, similiar procedures are given there, too.
Once the driver is replaced start the openocd that you downloaded previosly (not the general one):
C:\Users\Maxi\Desktop\openocd-esp32\bin>openocd.exe -s ../share/openocd/scripts -f interface/ftdi/esp32_devkitj_v1.cfg -f board/esp-wroom-32.cfg
Open On-Chip Debugger 0.10.0-dev (2018-04-18-12:04)
Licensed under GNU GPL v2
For bug reports, read
        http://openocd.org/doc/doxygen/bugs.html
none separate
adapter speed: 20000 kHz
esp32 interrupt mask on
force hard breakpoints
Error: libusb_open() failed with LIBUSB_ERROR_NOT_SUPPORTED
Info : ftdi: if you experience problems at higher adapter clocks, try the command "ftdi_tdo_sample_edge falling"
Info : clock speed 20000 kHz
Info : JTAG tap: esp32.cpu0 tap/device found: 0x120034e5 (mfg: 0x272 (Tensilica), part: 0x2003, ver: 0x1)
Info : JTAG tap: esp32.cpu1 tap/device found: 0x120034e5 (mfg: 0x272 (Tensilica), part: 0x2003, ver: 0x1)
cpu0: Current bits set: BreakIn BreakOut RunStallIn
cpu1: Current bits set: BreakIn BreakOut RunStallIn
Good, the openocd is now connected to the target. We now tell Eclipse how to use the right gdb. These are basically the same steps as described in Using Debugger - ESP32 - — ESP-IDF Programming Guide latest documentation.
- Create a new Debug Configuration for “GDB Hardware Debugging”
- “Main”:
- “C/C++” Application: The path to your
firmware.elf - Disable auto-build
- “C/C++” Application: The path to your
- “Debugger”:
- the path to
xtensa-esp32-elf-gdbas described above - “localhost” and “3333” used for the remote target
- the path to
- Startup:
- uncheck “Reset and Delay (seconds)” and “Halt”
- write
mon reset haltandx $a1=0as two lines in the text box - disable the checkmark at at “Load Image” in the “Load Image and Symbols” section
- Set breakpoint at:
loop(in this case, we want to break at there. You might want to break atsetup) - check “resume”
With openocd running and this configuration we can now press “debug”:
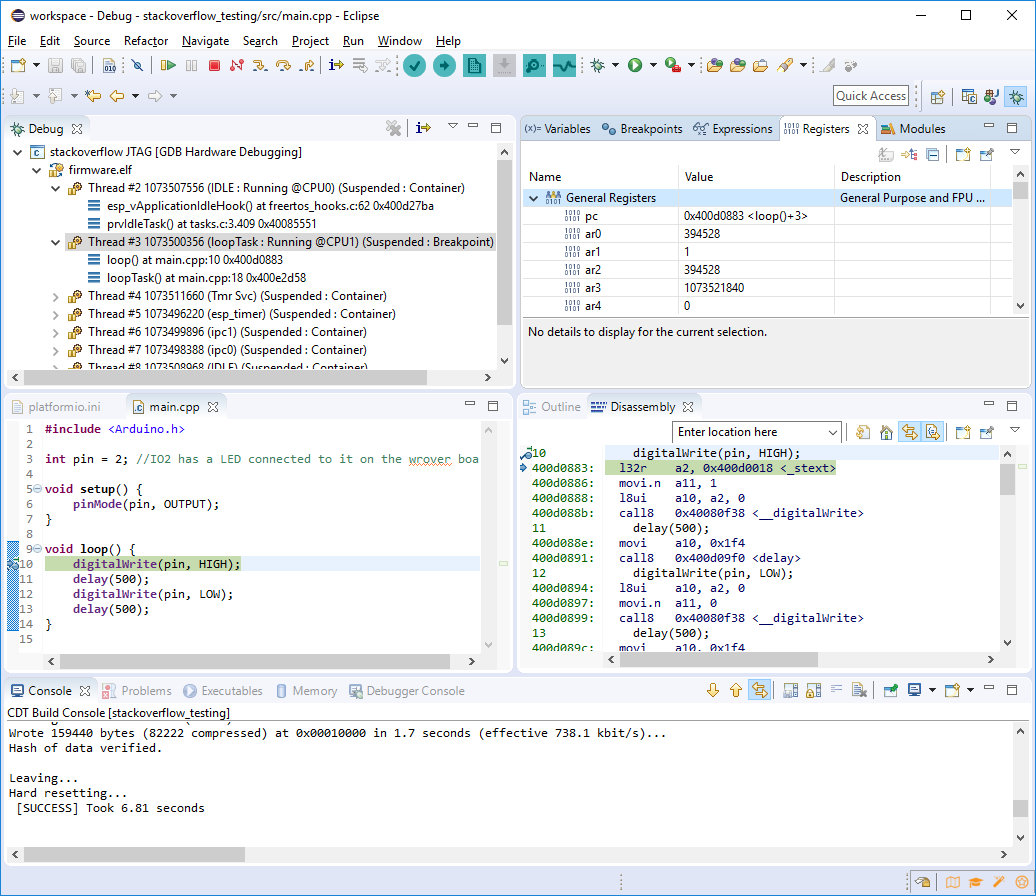
We can debug the ESP32 in all its glory. We see all threads from all CPUs, the registers, the disassembly, can do line-step debugging, et cetera.
Conclusion
In this tutorial I showed you how to use a openocd-gdb combination to connect to your target MCU. I showed you how to setup the debugging configuration in Eclipse and CLion. This made us able to debug two STM32 chips and the ESP32.
I hope you found this helpful.