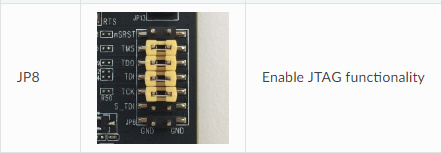
I followed strictly your instructions, however didn’t put the debug jumpers which are an important step for the WROVER KIT. Notice that my WROVER KIT is the version V4.1 which is a little bit different from the photo (the actual documentations fits for the V3 version). Anyway I found thoose four jumpers on the board and connected them:
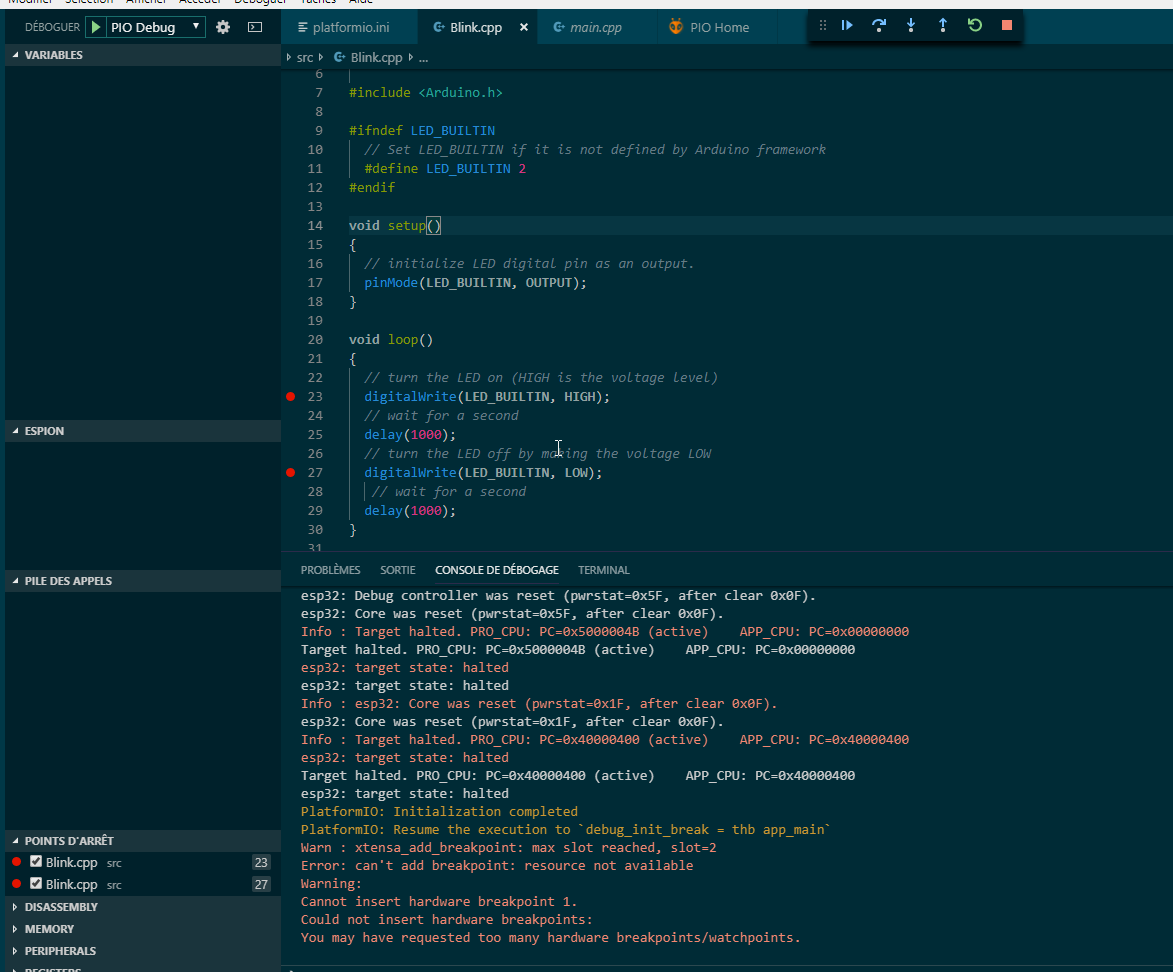
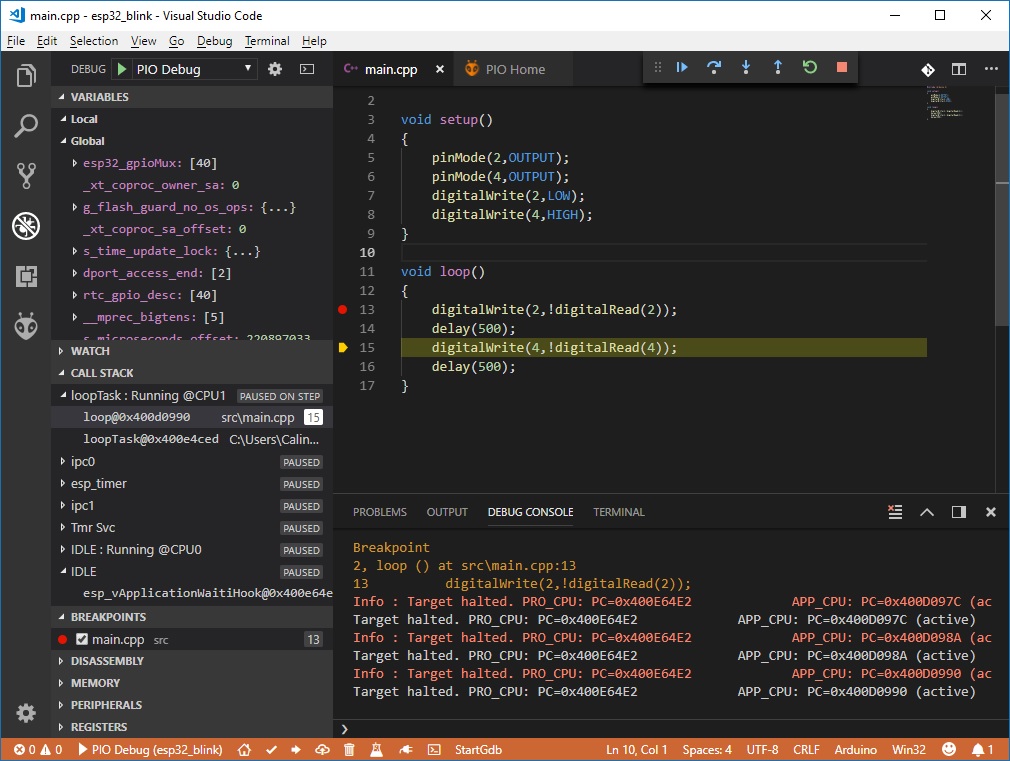
Now the debugg function is starting, but unable to stop at the breakpoint
Debug starting (before play):
.
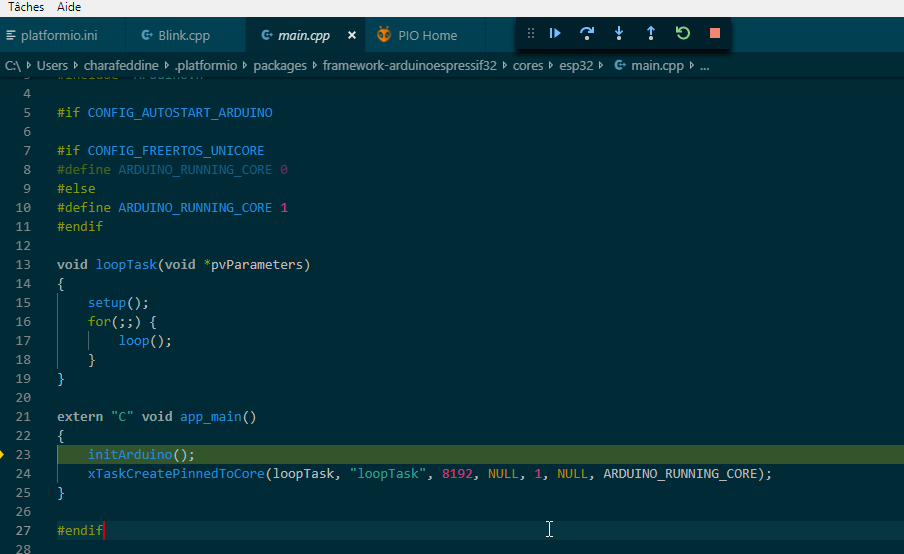
I’ve put the breakpoint at the first digitalwrite in the loop, see the code below:
/*
 * Blink
 * Turns on an LED on for one second,
 * then off for one second, repeatedly.
 */

#include <Arduino.h>

#ifndef LED_BUILTIN
  // Set LED_BUILTIN if it is not defined by Arduino framework
  #define LED_BUILTIN 2
#endif

void setup()
{
  // initialize LED digital pin as an output.
  pinMode(LED_BUILTIN, OUTPUT);
}

void loop()
{
  // turn the LED on (HIGH is the voltage level)
  digitalWrite(LED_BUILTIN, HIGH); //I PUT THE BREAKPOINT HERE
  // wait for a second
  delay(1000);
  // turn the LED off by making the voltage LOW
  digitalWrite(LED_BUILTIN, LOW);
   // wait for a second
  delay(1000);
}
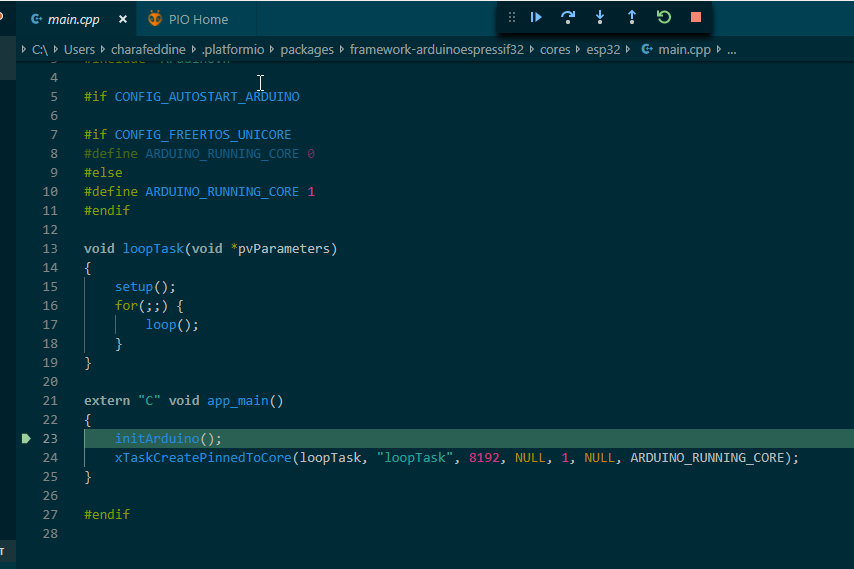
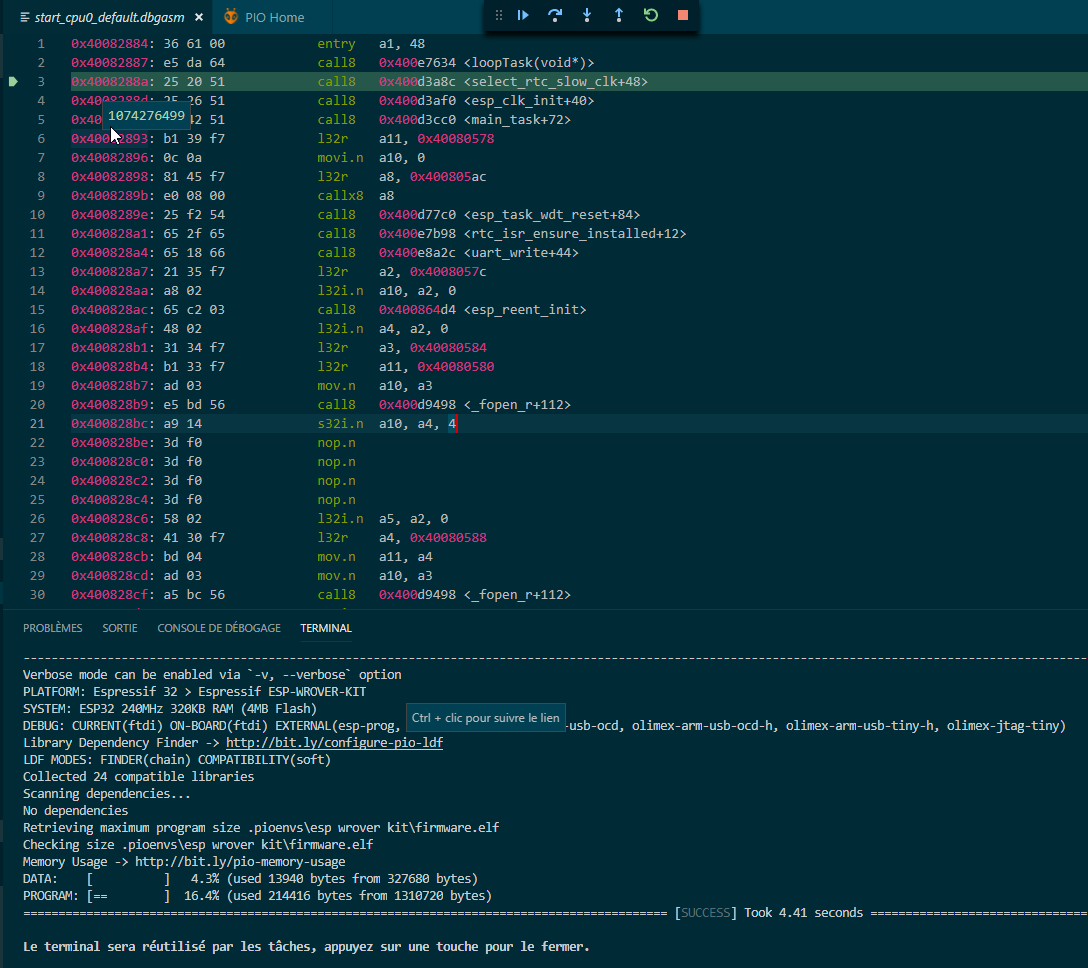
Then I push play, I didn’t stop at the Breakpoint and a few moment later I pushed pause:
Reading symbols from c:/Users/charafeddine/Documents/PlatformIO/Projects/180903-175715-arduino-blink/.pioenvs/esp wrover kit/firmware.elf...
done.
PlatformIO Unified Debugger > http://bit.ly/pio-debug
PlatformIO: Initializing remote target...
Open On-Chip Debugger 0.10.0-dev (2018-06-04-09:51)
Licensed under GNU GPL v2
For bug reports, read
	http://openocd.org/doc/doxygen/bugs.html
none separate
adapter speed: 20000 kHz
esp32 interrupt mask on
force hard breakpoints
Info : tcl server disabled
Info : telnet server disabled
Error: libusb_open() failed with LIBUSB_ERROR_NOT_SUPPORTED
Info : ftdi: if you experience problems at higher adapter clocks, try the command "ftdi_tdo_sample_edge falling"
Info : clock speed 20000 kHz
Info : JTAG tap: esp32.cpu0 tap/device found: 0x120034e5 (mfg: 0x272 (Tensilica), part: 0x2003, ver: 0x1)
Info : JTAG tap: esp32.cpu1 tap/device found: 0x120034e5 (mfg: 0x272 (Tensilica), part: 0x2003, ver: 0x1)
cpu0: Current bits set: BreakIn BreakOut RunStallIn
cpu1: Current bits set: BreakIn BreakOut RunStallIn
Info : accepting 'gdb' connection from pipe
Info : Target halted. PRO_CPU: PC=0x400E8E5E (active)    APP_CPU: PC=0x400E8E5E
esp32: target state: halted
Info : Use core0 of target 'esp32'
Info : Target halted. PRO_CPU: PC=0x40091D07 (active)    APP_CPU: PC=0x4008B863
Info : Auto-detected flash size 4096 KB
Info : Using flash size 4096 KB
0x400e8e5e in __udivmoddi4 (rp=0x0, d=<optimized out>, n=<optimized out>) at /builds/idf/crosstool-NG/.build/src/gcc-5.2.0/libgcc/libgcc2.c:1199
1199	/builds/idf/crosstool-NG/.build/src/gcc-5.2.0/libgcc/libgcc2.c: No such file or directory.
Not implemented stop reason (assuming exception): undefined
Hardware assisted breakpoint 1 at 0x400e7643: file C:\Users\charafeddine\.platformio\packages\framework-arduinoespressif32\cores\esp32\main.cpp, line 23.
Info : JTAG tap: esp32.cpu0 tap/device found: 0x120034e5 (mfg: 0x272 (Tensilica), part: 0x2003, ver: 0x1)
Info : JTAG tap: esp32.cpu1 tap/device found: 0x120034e5 (mfg: 0x272 (Tensilica), part: 0x2003, ver: 0x1)
JTAG tap: esp32.cpu0 tap/device found: 0x120034e5 (mfg: 0x272 (Tensilica), part: 0x2003, ver: 0x1)
JTAG tap: esp32.cpu1 tap/device found: 0x120034e5 (mfg: 0x272 (Tensilica), part: 0x2003, ver: 0x1)
cpu0: Current bits set: BreakIn BreakOut RunStallIn
cpu1: Current bits set: BreakIn BreakOut RunStallIn
cpu0: Current bits set: BreakIn BreakOut RunStallIn
cpu1: Current bits set: BreakIn BreakOut RunStallIn
Info : esp32: Debug controller was reset (pwrstat=0x5F, after clear 0x0F).
Info : esp32: Core was reset (pwrstat=0x5F, after clear 0x0F).
esp32: Debug controller was reset (pwrstat=0x5F, after clear 0x0F).
esp32: Core was reset (pwrstat=0x5F, after clear 0x0F).
Info : Target halted. PRO_CPU: PC=0x5000004B (active)    APP_CPU: PC=0x00000000
esp32: target state: halted
Target halted. PRO_CPU: PC=0x5000004B (active)    APP_CPU: PC=0x00000000
esp32: target state: halted
Info : esp32: Core was reset (pwrstat=0x1F, after clear 0x0F).
esp32: Core was reset (pwrstat=0x1F, after clear 0x0F).
Info : Target halted. PRO_CPU: PC=0x40000400 (active)    APP_CPU: PC=0x40000400
esp32: target state: halted
** Programming Started **
Target halted. PRO_CPU: PC=0x40000400 (active)    APP_CPU: PC=0x40000400
esp32: target state: halted
** Programming Started **
auto erase enabled
Info : Use core0 of target 'esp32'
auto erase enabled
Use core0 of target 'esp32'
Info : Target halted. PRO_CPU: PC=0x40091D07 (active)    APP_CPU: PC=0x400076E2
Target halted. PRO_CPU: PC=0x40091D07 (active)    APP_CPU: PC=0x400076E2
Info : Use core0 of target 'esp32'
Use core0 of target 'esp32'
Info : Target halted. PRO_CPU: PC=0x40091D07 (active)    APP_CPU: PC=0x400076E0
Target halted. PRO_CPU: PC=0x40091D07 (active)    APP_CPU: PC=0x400076E0
wrote 16384 bytes from file C:/Users/charafeddine/.platformio/packages/framework-arduinoespressif32/tools/sdk/bin/bootloader_dio_40m.bin in 1.048960s (15.253 KiB/s)
** Programming Finished **
wrote 16384 bytes from file C:/Users/charafeddine/.platformio/packages/framework-arduinoespressif32/tools/sdk/bin/bootloader_dio_40m.bin in 1.048960s (15.253 KiB/s)
** Programming Finished **
** Verify Started **
Info : Use core0 of target 'esp32'
** Verify Started **
Use core0 of target 'esp32'
Info : Target halted. PRO_CPU: PC=0x40091D07 (active)    APP_CPU: PC=0x400076E2
Target halted. PRO_CPU: PC=0x40091D07 (active)    APP_CPU: PC=0x400076E2
read 15088 bytes from file C:/Users/charafeddine/.platformio/packages/framework-arduinoespressif32/tools/sdk/bin/bootloader_dio_40m.bin and flash bank 0 at offset 0x00001000 in 0.331241s (44.482 KiB/s)
contents match
** Verified OK **
read 15088 bytes from file C:/Users/charafeddine/.platformio/packages/framework-arduinoespressif32/tools/sdk/bin/bootloader_dio_40m.bin and flash bank 0 at offset 0x00001000 in 0.331241s (44.482 KiB/s)
contents match
** Verified OK **
Info : JTAG tap: esp32.cpu0 tap/device found: 0x120034e5 (mfg: 0x272 (Tensilica), part: 0x2003, ver: 0x1)
Info : JTAG tap: esp32.cpu1 tap/device found: 0x120034e5 (mfg: 0x272 (Tensilica), part: 0x2003, ver: 0x1)
cpu0: Current bits set: BreakIn BreakOut RunStallIn
cpu1: Current bits set: BreakIn BreakOut RunStallIn
JTAG tap: esp32.cpu0 tap/device found: 0x120034e5 (mfg: 0x272 (Tensilica), part: 0x2003, ver: 0x1)
JTAG tap: esp32.cpu1 tap/device found: 0x120034e5 (mfg: 0x272 (Tensilica), part: 0x2003, ver: 0x1)
cpu0: Current bits set: BreakIn BreakOut RunStallIn
cpu1: Current bits set: BreakIn BreakOut RunStallIn
Info : esp32: Debug controller was reset (pwrstat=0x5F, after clear 0x0F).
Info : esp32: Core was reset (pwrstat=0x5F, after clear 0x0F).
esp32: Debug controller was reset (pwrstat=0x5F, after clear 0x0F).
esp32: Core was reset (pwrstat=0x5F, after clear 0x0F).
Info : Target halted. PRO_CPU: PC=0x5000004B (active)    APP_CPU: PC=0x00000000
esp32: target state: halted
Target halted. PRO_CPU: PC=0x5000004B (active)    APP_CPU: PC=0x00000000
esp32: target state: halted
Info : esp32: Core was reset (pwrstat=0x1F, after clear 0x0F).
esp32: Core was reset (pwrstat=0x1F, after clear 0x0F).
Info : Target halted. PRO_CPU: PC=0x40000400 (active)    APP_CPU: PC=0x40000400
esp32: target state: halted
** Programming Started **
Target halted. PRO_CPU: PC=0x40000400 (active)    APP_CPU: PC=0x40000400
auto erase enabled
Error: Invalid command argument
image.base_address option value ('wrover') is not valid
esp32: target state: halted
embedded:startup.tcl:454: Error: ** Programming Failed **
in procedure 'program_esp32'
in procedure 'program_error' called at file "C:/Users/charafeddine/.platformio/packages/tool-openocd-esp32/share/openocd/scripts/target/esp32.cfg", line 155
at file "embedded:startup.tcl", line 454
** Programming Started **
auto erase enabled
Invalid command argument
image.base_address option value ('wrover') is not valid
embedded:startup.tcl:454: Error: ** Programming Failed **
in procedure 'program_esp32'
in procedure 'program_error' called at file "C:/Users/charafeddine/.platformio/packages/tool-openocd-esp32/share/openocd/scripts/target/esp32.cfg", line 155
at file "embedded:startup.tcl", line 454
Info : JTAG tap: esp32.cpu0 tap/device found: 0x120034e5 (mfg: 0x272 (Tensilica), part: 0x2003, ver: 0x1)
Info : JTAG tap: esp32.cpu1 tap/device found: 0x120034e5 (mfg: 0x272 (Tensilica), part: 0x2003, ver: 0x1)
JTAG tap: esp32.cpu0 tap/device found: 0x120034e5 (mfg: 0x272 (Tensilica), part: 0x2003, ver: 0x1)
JTAG tap: esp32.cpu1 tap/device found: 0x120034e5 (mfg: 0x272 (Tensilica), part: 0x2003, ver: 0x1)
cpu0: Current bits set: BreakIn BreakOut RunStallIn
cpu1: Current bits set: BreakIn BreakOut RunStallIn
cpu0: Current bits set: BreakIn BreakOut RunStallIn
cpu1: Current bits set: BreakIn BreakOut RunStallIn
Info : esp32: Debug controller was reset (pwrstat=0x5F, after clear 0x0F).
Info : esp32: Core was reset (pwrstat=0x5F, after clear 0x0F).
esp32: Debug controller was reset (pwrstat=0x5F, after clear 0x0F).
esp32: Core was reset (pwrstat=0x5F, after clear 0x0F).
Info : Target halted. PRO_CPU: PC=0x5000004B (active)    APP_CPU: PC=0x00000000
Target halted. PRO_CPU: PC=0x5000004B (active)    APP_CPU: PC=0x00000000
esp32: target state: halted
esp32: target state: halted
Info : esp32: Core was reset (pwrstat=0x1F, after clear 0x0F).
esp32: Core was reset (pwrstat=0x1F, after clear 0x0F).
Info : Target halted. PRO_CPU: PC=0x40000400 (active)    APP_CPU: PC=0x40000400
esp32: target state: halted
Target halted. PRO_CPU: PC=0x40000400 (active)    APP_CPU: PC=0x40000400
esp32: target state: halted
** Programming Started **
auto erase enabled
Info : Use core0 of target 'esp32'
** Programming Started **
auto erase enabled
Use core0 of target 'esp32'
Info : Target halted. PRO_CPU: PC=0x40091D07 (active)    APP_CPU: PC=0x400076E2
Target halted. PRO_CPU: PC=0x40091D07 (active)    APP_CPU: PC=0x400076E2
Info : Use core0 of target 'esp32'
Use core0 of target 'esp32'
Info : Target halted. PRO_CPU: PC=0x40091D07 (active)    APP_CPU: PC=0x400076E0
Target halted. PRO_CPU: PC=0x40091D07 (active)    APP_CPU: PC=0x400076E0
wrote 8192 bytes from file C:/Users/charafeddine/.platformio/packages/framework-arduinoespressif32/tools/partitions/boot_app0.bin in 0.817306s (9.788 KiB/s)
** Programming Finished **
wrote 8192 bytes from file C:/Users/charafeddine/.platformio/packages/framework-arduinoespressif32/tools/partitions/boot_app0.bin in 0.817306s (9.788 KiB/s)
** Programming Finished **
** Verify Started **
Info : Use core0 of target 'esp32'
** Verify Started **
Use core0 of target 'esp32'
Info : Target halted. PRO_CPU: PC=0x40091D07 (active)    APP_CPU: PC=0x400076E2
Target halted. PRO_CPU: PC=0x40091D07 (active)    APP_CPU: PC=0x400076E2
read 8192 bytes from file C:/Users/charafeddine/.platformio/packages/framework-arduinoespressif32/tools/partitions/boot_app0.bin and flash bank 0 at offset 0x0000e000 in 0.301036s (26.575 KiB/s)
contents match
** Verified OK **
read 8192 bytes from file C:/Users/charafeddine/.platformio/packages/framework-arduinoespressif32/tools/partitions/boot_app0.bin and flash bank 0 at offset 0x0000e000 in 0.301036s (26.575 KiB/s)
contents match
** Verified OK **
Info : JTAG tap: esp32.cpu0 tap/device found: 0x120034e5 (mfg: 0x272 (Tensilica), part: 0x2003, ver: 0x1)
Info : JTAG tap: esp32.cpu1 tap/device found: 0x120034e5 (mfg: 0x272 (Tensilica), part: 0x2003, ver: 0x1)
cpu0: Current bits set: BreakIn BreakOut RunStallIn
cpu1: Current bits set: BreakIn BreakOut RunStallIn
JTAG tap: esp32.cpu0 tap/device found: 0x120034e5 (mfg: 0x272 (Tensilica), part: 0x2003, ver: 0x1)
JTAG tap: esp32.cpu1 tap/device found: 0x120034e5 (mfg: 0x272 (Tensilica), part: 0x2003, ver: 0x1)
cpu0: Current bits set: BreakIn BreakOut RunStallIn
cpu1: Current bits set: BreakIn BreakOut RunStallIn
Info : esp32: Debug controller was reset (pwrstat=0x5F, after clear 0x0F).
Info : esp32: Core was reset (pwrstat=0x5F, after clear 0x0F).
esp32: Debug controller was reset (pwrstat=0x5F, after clear 0x0F).
esp32: Core was reset (pwrstat=0x5F, after clear 0x0F).
Info : Target halted. PRO_CPU: PC=0x5000004B (active)    APP_CPU: PC=0x00000000
esp32: target state: halted
Target halted. PRO_CPU: PC=0x5000004B (active)    APP_CPU: PC=0x00000000
esp32: target state: halted
Info : esp32: Core was reset (pwrstat=0x1F, after clear 0x0F).
esp32: Core was reset (pwrstat=0x1F, after clear 0x0F).
Info : Target halted. PRO_CPU: PC=0x40000400 (active)    APP_CPU: PC=0x40000400
Target halted. PRO_CPU: PC=0x40000400 (active)    APP_CPU: PC=0x40000400
esp32: target state: halted
** Programming Started **
auto erase enabled
Error: Invalid command argument
image.base_address option value ('wrover') is not valid
embedded:startup.tcl:454: Error: ** Programming Failed **
in procedure 'program_esp32'
in procedure 'program_error' called at file "C:/Users/charafeddine/.platformio/packages/tool-openocd-esp32/share/openocd/scripts/target/esp32.cfg", line 155
at file "embedded:startup.tcl", line 454
esp32: target state: halted
** Programming Started **
auto erase enabled
Invalid command argument
image.base_address option value ('wrover') is not valid
embedded:startup.tcl:454: Error: ** Programming Failed **
in procedure 'program_esp32'
in procedure 'program_error' called at file "C:/Users/charafeddine/.platformio/packages/tool-openocd-esp32/share/openocd/scripts/target/esp32.cfg", line 155
at file "embedded:startup.tcl", line 454
Info : JTAG tap: esp32.cpu0 tap/device found: 0x120034e5 (mfg: 0x272 (Tensilica), part: 0x2003, ver: 0x1)
Info : JTAG tap: esp32.cpu1 tap/device found: 0x120034e5 (mfg: 0x272 (Tensilica), part: 0x2003, ver: 0x1)
cpu0: Current bits set: BreakIn BreakOut RunStallIn
cpu1: Current bits set: BreakIn BreakOut RunStallIn
JTAG tap: esp32.cpu0 tap/device found: 0x120034e5 (mfg: 0x272 (Tensilica), part: 0x2003, ver: 0x1)
JTAG tap: esp32.cpu1 tap/device found: 0x120034e5 (mfg: 0x272 (Tensilica), part: 0x2003, ver: 0x1)
cpu0: Current bits set: BreakIn BreakOut RunStallIn
cpu1: Current bits set: BreakIn BreakOut RunStallIn
Info : esp32: Debug controller was reset (pwrstat=0x5F, after clear 0x0F).
Info : esp32: Core was reset (pwrstat=0x5F, after clear 0x0F).
esp32: Debug controller was reset (pwrstat=0x5F, after clear 0x0F).
esp32: Core was reset (pwrstat=0x5F, after clear 0x0F).
Info : Target halted. PRO_CPU: PC=0x5000004B (active)    APP_CPU: PC=0x00000000
esp32: target state: halted
Target halted. PRO_CPU: PC=0x5000004B (active)    APP_CPU: PC=0x00000000
esp32: target state: halted
Info : esp32: Core was reset (pwrstat=0x1F, after clear 0x0F).
esp32: Core was reset (pwrstat=0x1F, after clear 0x0F).
Info : Target halted. PRO_CPU: PC=0x40000400 (active)    APP_CPU: PC=0x40000400
esp32: target state: halted
Target halted. PRO_CPU: PC=0x40000400 (active)    APP_CPU: PC=0x40000400
esp32: target state: halted
PlatformIO: Initialization completed
PlatformIO: Resume the execution to `debug_init_break = thb app_main`
Info : Target halted. PRO_CPU: PC=0x400E7643 (active)    APP_CPU: PC=0x4008295F
Target halted. PRO_CPU: PC=0x400E7643 (active)    APP_CPU: PC=0x4008295F

Temporary breakpoint
1, app_main () at C:\Users\charafeddine\.platformio\packages\framework-arduinoespressif32\cores\esp32\main.cpp:23
23	    initArduino();
Info : Target halted. PRO_CPU: PC=0x400E8E5E (active)    APP_CPU: PC=0x400E8E5E
Target halted. PRO_CPU: PC=0x400E8E5E (active)    APP_CPU: PC=0x400E8E5E
[New Thread 1073511988]
[New Thread 1073422388]
[New Thread 1073514680]
[New Thread 1073502916]
[New Thread 1073499088]
[New Thread 1073501408]

Program received signal
SIGINT, Interrupt.
[Switching to Thread 1073510576]
0x400e8e5e in __udivmoddi4 (rp=0x0, d=<optimized out>, n=<optimized out>) at /builds/idf/crosstool-NG/.build/src/gcc-5.2.0/libgcc/libgcc2.c:1199
1199	/builds/idf/crosstool-NG/.build/src/gcc-5.2.0/libgcc/libgcc2.c: No such file or directory.
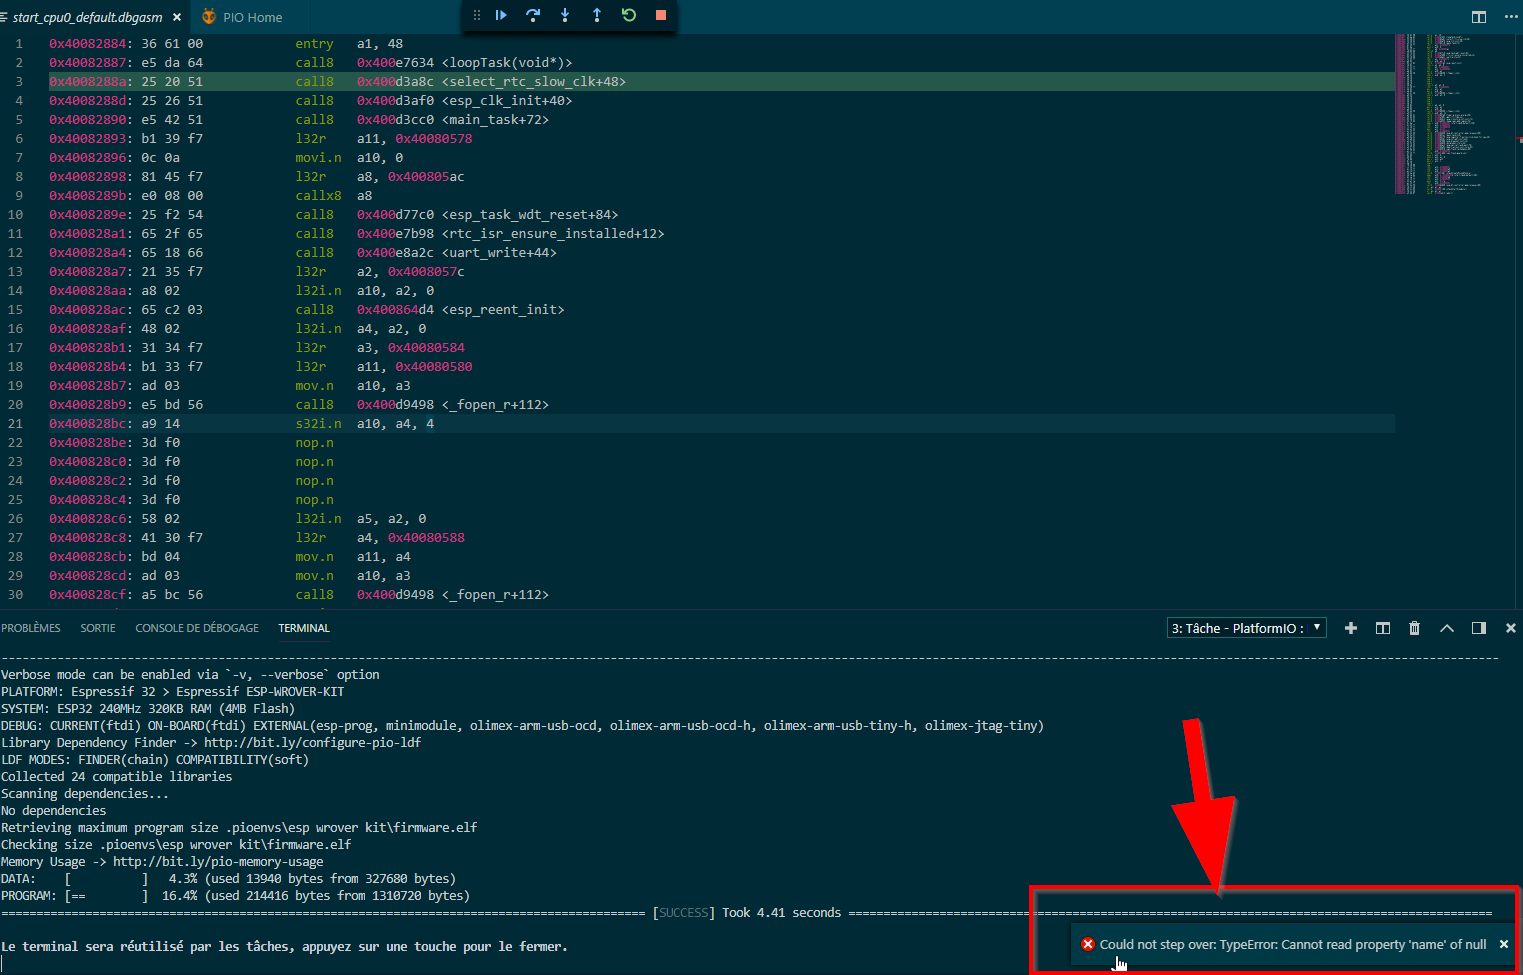
We can’t see this here but in a previous test the debug console said that it couldn’t insert a breakpoint.