I ran into a problem using PIO Debugger with a FTDI Minimodule on a Fedora machine. All the drivers are installed correctly and having a look at the debug console, the debugger is able to establish communication. It detects all the cores and threads running on the ESP32.
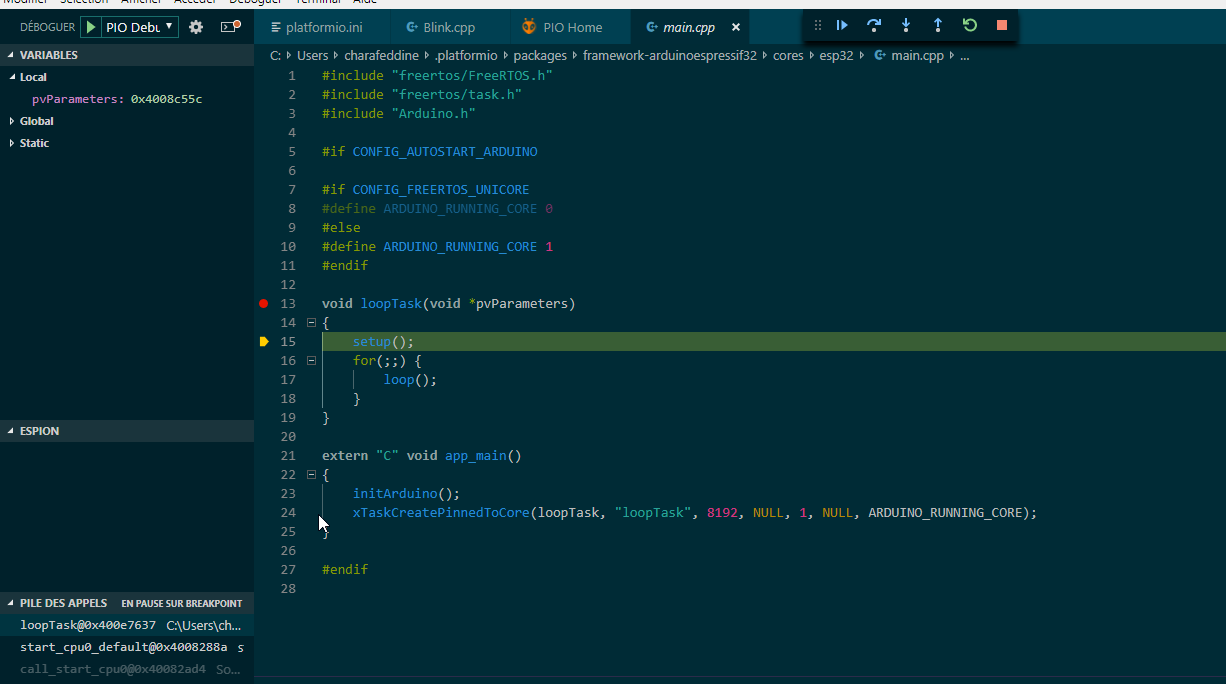
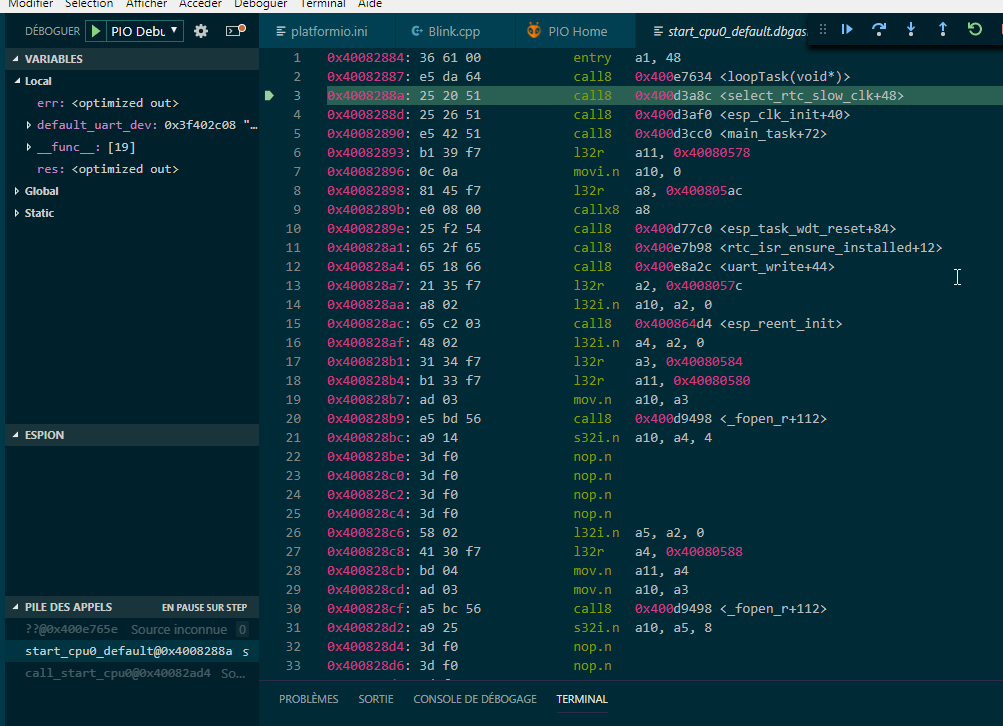
But as soon as i reach the temporary breakpoint at app_main, a GDB internal problem is detected:
PlatformIO Unified Debugger > http://bit.ly/pio-debug
PlatformIO: Initializing remote target...
Open On-Chip Debugger 0.10.0-dev (2018-06-04-09:50)
Licensed under GNU GPL v2
For bug reports, read
	http://openocd.org/doc/doxygen/bugs.html
none separate
adapter speed: 20000 kHz
esp32 interrupt mask on
force hard breakpoints
Info : tcl server disabled
Info : telnet server disabled
Info : ftdi: if you experience problems at higher adapter clocks, try the command "ftdi_tdo_sample_edge falling"
Info : clock speed 20000 kHz
Info : JTAG tap: esp32.cpu0 tap/device found: 0x120034e5 (mfg: 0x272 (Tensilica), part: 0x2003, ver: 0x1)
Info : JTAG tap: esp32.cpu1 tap/device found: 0x120034e5 (mfg: 0x272 (Tensilica), part: 0x2003, ver: 0x1)
Info : Target halted. PRO_CPU: PC=0x400D0964 (active)    APP_CPU: PC=0x400E2956
cpu0: Current bits set: BreakIn BreakOut RunStallIn
cpu1: Current bits set: BreakIn BreakOut RunStallIn
Info : accepting 'gdb' connection from pipe
Info : Use core0 of target 'esp32'
Info : Target halted. PRO_CPU: PC=0x40091D07 (active)    APP_CPU: PC=0x400E2956
Info : Auto-detected flash size 4096 KB
Info : Using flash size 4096 KB
esp_perip_clk_init () at /home/mkrummenchacher/.platformio/packages/framework-espidf/components/esp32/clk.c:213
213	        hwcrypto_perip_clk = ~DPORT_READ_PERI_REG(DPORT_PERI_CLK_EN_REG);
Not implemented stop reason (assuming exception): undefined
Hardware assisted breakpoint 1 at 0x400d07ab: file src/main.c, line 43.
Info : JTAG tap: esp32.cpu0 tap/device found: 0x120034e5 (mfg: 0x272 (Tensilica), part: 0x2003, ver: 0x1)
Info : JTAG tap: esp32.cpu1 tap/device found: 0x120034e5 (mfg: 0x272 (Tensilica), part: 0x2003, ver: 0x1)
JTAG tap: esp32.cpu0 tap/device found: 0x120034e5 (mfg: 0x272 (Tensilica), part: 0x2003, ver: 0x1)
cpu0: Current bits set: BreakIn BreakOut RunStallIn
JTAG tap: esp32.cpu1 tap/device found: 0x120034e5 (mfg: 0x272 (Tensilica), part: 0x2003, ver: 0x1)
cpu1: Current bits set: BreakIn BreakOut RunStallIn
cpu0: Current bits set: BreakIn BreakOut RunStallIn
cpu1: Current bits set: BreakIn BreakOut RunStallIn
Info : esp32: Debug controller was reset (pwrstat=0x5F, after clear 0x0F).
Info : esp32: Core was reset (pwrstat=0x5F, after clear 0x0F).
esp32: Debug controller was reset (pwrstat=0x5F, after clear 0x0F).
esp32: Core was reset (pwrstat=0x5F, after clear 0x0F).
Info : Target halted. PRO_CPU: PC=0x5000004B (active)    APP_CPU: PC=0x00000000
Target halted. PRO_CPU: PC=0x5000004B (active)    APP_CPU: PC=0x00000000
esp32: target state: halted
esp32: target state: halted
Info : esp32: Core was reset (pwrstat=0x1F, after clear 0x0F).
esp32: Core was reset (pwrstat=0x1F, after clear 0x0F).
Info : Target halted. PRO_CPU: PC=0x40000400 (active)    APP_CPU: PC=0x40000400
Target halted. PRO_CPU: PC=0x40000400 (active)    APP_CPU: PC=0x40000400
esp32: target state: halted
esp32: target state: halted
** Programming Started **
** Programming Started **
auto erase enabled
auto erase enabled
Info : Use core0 of target 'esp32'
Use core0 of target 'esp32'
Info : Target halted. PRO_CPU: PC=0x40091D07 (active)    APP_CPU: PC=0x400076DD
Target halted. PRO_CPU: PC=0x40091D07 (active)    APP_CPU: PC=0x400076DD
Info : Use core0 of target 'esp32'
Use core0 of target 'esp32'
Info : Target halted. PRO_CPU: PC=0x40091D07 (active)    APP_CPU: PC=0x400076DD
Target halted. PRO_CPU: PC=0x40091D07 (active)    APP_CPU: PC=0x400076DD
wrote 24576 bytes from file /home/mkrummenchacher/Documents/PlatformIO/platform-espressif32-master/examples/espidf-blink/.pioenvs/esp-wrover-kit/bootloader.bin in 0.971230s (24.711 KiB/s)
wrote 24576 bytes from file /home/mkrummenchacher/Documents/PlatformIO/platform-espressif32-master/examples/espidf-blink/.pioenvs/esp-wrover-kit/bootloader.bin in 0.971230s (24.711 KiB/s)
** Programming Finished **
** Programming Finished **
** Verify Started **
** Verify Started **
Info : Use core0 of target 'esp32'
Use core0 of target 'esp32'
Info : Target halted. PRO_CPU: PC=0x40091D07 (active)    APP_CPU: PC=0x400076E0
Target halted. PRO_CPU: PC=0x40091D07 (active)    APP_CPU: PC=0x400076E0
read 20704 bytes from file /home/mkrummenchacher/Documents/PlatformIO/platform-espressif32-master/examples/espidf-blink/.pioenvs/esp-wrover-kit/bootloader.bin and flash bank 0 at offset 0x00001000 in 0.342424s (59.046 KiB/s)
contents match
** Verified OK **
read 20704 bytes from file /home/mkrummenchacher/Documents/PlatformIO/platform-espressif32-master/examples/espidf-blink/.pioenvs/esp-wrover-kit/bootloader.bin and flash bank 0 at offset 0x00001000 in 0.342424s (59.046 KiB/s)
contents match
** Verified OK **
Info : JTAG tap: esp32.cpu0 tap/device found: 0x120034e5 (mfg: 0x272 (Tensilica), part: 0x2003, ver: 0x1)
Info : JTAG tap: esp32.cpu1 tap/device found: 0x120034e5 (mfg: 0x272 (Tensilica), part: 0x2003, ver: 0x1)
JTAG tap: esp32.cpu0 tap/device found: 0x120034e5 (mfg: 0x272 (Tensilica), part: 0x2003, ver: 0x1)
cpu0: Current bits set: BreakIn BreakOut RunStallIn
cpu1: Current bits set: BreakIn BreakOut RunStallIn
JTAG tap: esp32.cpu1 tap/device found: 0x120034e5 (mfg: 0x272 (Tensilica), part: 0x2003, ver: 0x1)
cpu0: Current bits set: BreakIn BreakOut RunStallIn
cpu1: Current bits set: BreakIn BreakOut RunStallIn
Info : esp32: Debug controller was reset (pwrstat=0x5F, after clear 0x0F).
Info : esp32: Core was reset (pwrstat=0x5F, after clear 0x0F).
esp32: Debug controller was reset (pwrstat=0x5F, after clear 0x0F).
esp32: Core was reset (pwrstat=0x5F, after clear 0x0F).
Info : Target halted. PRO_CPU: PC=0x5000004B (active)    APP_CPU: PC=0x00000000
Target halted. PRO_CPU: PC=0x5000004B (active)    APP_CPU: PC=0x00000000
esp32: target state: halted
esp32: target state: halted
Info : esp32: Core was reset (pwrstat=0x1F, after clear 0x0F).
esp32: Core was reset (pwrstat=0x1F, after clear 0x0F).
Info : Target halted. PRO_CPU: PC=0x40000400 (active)    APP_CPU: PC=0x40000400
Target halted. PRO_CPU: PC=0x40000400 (active)    APP_CPU: PC=0x40000400
esp32: target state: halted
esp32: target state: halted
** Programming Started **
** Programming Started **
auto erase enabled
auto erase enabled
Info : Use core0 of target 'esp32'
Use core0 of target 'esp32'
Info : Target halted. PRO_CPU: PC=0x40091D07 (active)    APP_CPU: PC=0x400076DD
Target halted. PRO_CPU: PC=0x40091D07 (active)    APP_CPU: PC=0x400076DD
Info : Use core0 of target 'esp32'
Use core0 of target 'esp32'
Info : Target halted. PRO_CPU: PC=0x40091D07 (active)    APP_CPU: PC=0x400076E2
Target halted. PRO_CPU: PC=0x40091D07 (active)    APP_CPU: PC=0x400076E2
wrote 4096 bytes from file /home/mkrummenchacher/Documents/PlatformIO/platform-espressif32-master/examples/espidf-blink/.pioenvs/esp-wrover-kit/partitions.bin in 0.660603s (6.055 KiB/s)
wrote 4096 bytes from file /home/mkrummenchacher/Documents/PlatformIO/platform-espressif32-master/examples/espidf-blink/.pioenvs/esp-wrover-kit/partitions.bin in 0.660603s (6.055 KiB/s)
** Programming Finished **
** Programming Finished **
** Verify Started **
** Verify Started **
Info : Use core0 of target 'esp32'
Use core0 of target 'esp32'
Info : Target halted. PRO_CPU: PC=0x40091D07 (active)    APP_CPU: PC=0x400076DD
Target halted. PRO_CPU: PC=0x40091D07 (active)    APP_CPU: PC=0x400076DD
read 3072 bytes from file /home/mkrummenchacher/Documents/PlatformIO/platform-espressif32-master/examples/espidf-blink/.pioenvs/esp-wrover-kit/partitions.bin and flash bank 0 at offset 0x00008000 in 0.281260s (10.666 KiB/s)
contents match
** Verified OK **
read 3072 bytes from file /home/mkrummenchacher/Documents/PlatformIO/platform-espressif32-master/examples/espidf-blink/.pioenvs/esp-wrover-kit/partitions.bin and flash bank 0 at offset 0x00008000 in 0.281260s (10.666 KiB/s)
contents match
** Verified OK **
Info : JTAG tap: esp32.cpu0 tap/device found: 0x120034e5 (mfg: 0x272 (Tensilica), part: 0x2003, ver: 0x1)
Info : JTAG tap: esp32.cpu1 tap/device found: 0x120034e5 (mfg: 0x272 (Tensilica), part: 0x2003, ver: 0x1)
JTAG tap: esp32.cpu0 tap/device found: 0x120034e5 (mfg: 0x272 (Tensilica), part: 0x2003, ver: 0x1)
cpu0: Current bits set: BreakIn BreakOut RunStallIn
cpu1: Current bits set: BreakIn BreakOut RunStallIn
JTAG tap: esp32.cpu1 tap/device found: 0x120034e5 (mfg: 0x272 (Tensilica), part: 0x2003, ver: 0x1)
cpu0: Current bits set: BreakIn BreakOut RunStallIn
cpu1: Current bits set: BreakIn BreakOut RunStallIn
Info : esp32: Debug controller was reset (pwrstat=0x5F, after clear 0x0F).
Info : esp32: Core was reset (pwrstat=0x5F, after clear 0x0F).
esp32: Debug controller was reset (pwrstat=0x5F, after clear 0x0F).
esp32: Core was reset (pwrstat=0x5F, after clear 0x0F).
Info : Target halted. PRO_CPU: PC=0x5000004B (active)    APP_CPU: PC=0x00000000
Target halted. PRO_CPU: PC=0x5000004B (active)    APP_CPU: PC=0x00000000
esp32: target state: halted
esp32: target state: halted
Info : esp32: Core was reset (pwrstat=0x1F, after clear 0x0F).
esp32: Core was reset (pwrstat=0x1F, after clear 0x0F).
Info : Target halted. PRO_CPU: PC=0x40000400 (active)    APP_CPU: PC=0x40000400
Target halted. PRO_CPU: PC=0x40000400 (active)    APP_CPU: PC=0x40000400
esp32: target state: halted
esp32: target state: halted
** Programming Started **
** Programming Started **
auto erase enabled
auto erase enabled
Info : Use core0 of target 'esp32'
Use core0 of target 'esp32'
Info : Target halted. PRO_CPU: PC=0x40091D07 (active)    APP_CPU: PC=0x400076E2
Target halted. PRO_CPU: PC=0x40091D07 (active)    APP_CPU: PC=0x400076E2
Info : Use core0 of target 'esp32'
Use core0 of target 'esp32'
Info : Target halted. PRO_CPU: PC=0x40091D07 (active)    APP_CPU: PC=0x400076E2
Target halted. PRO_CPU: PC=0x40091D07 (active)    APP_CPU: PC=0x400076E2
wrote 143360 bytes from file /home/mkrummenchacher/Documents/PlatformIO/platform-espressif32-master/examples/espidf-blink/.pioenvs/esp-wrover-kit/firmware.bin in 2.168328s (64.566 KiB/s)
** Programming Finished **
wrote 143360 bytes from file /home/mkrummenchacher/Documents/PlatformIO/platform-espressif32-master/examples/espidf-blink/.pioenvs/esp-wrover-kit/firmware.bin in 2.168328s (64.566 KiB/s)
** Verify Started **
** Programming Finished **
** Verify Started **
Info : Use core0 of target 'esp32'
Use core0 of target 'esp32'
Info : Target halted. PRO_CPU: PC=0x40091D07 (active)    APP_CPU: PC=0x400076E2
Target halted. PRO_CPU: PC=0x40091D07 (active)    APP_CPU: PC=0x400076E2
read 140000 bytes from file /home/mkrummenchacher/Documents/PlatformIO/platform-espressif32-master/examples/espidf-blink/.pioenvs/esp-wrover-kit/firmware.bin and flash bank 0 at offset 0x00010000 in 0.717120s (190.650 KiB/s)
contents match
** Verified OK **
read 140000 bytes from file /home/mkrummenchacher/Documents/PlatformIO/platform-espressif32-master/examples/espidf-blink/.pioenvs/esp-wrover-kit/firmware.bin and flash bank 0 at offset 0x00010000 in 0.717120s (190.650 KiB/s)
contents match
** Verified OK **
Info : JTAG tap: esp32.cpu0 tap/device found: 0x120034e5 (mfg: 0x272 (Tensilica), part: 0x2003, ver: 0x1)
JTAG tap: esp32.cpu0 tap/device found: 0x120034e5 (mfg: 0x272 (Tensilica), part: 0x2003, ver: 0x1)
Info : JTAG tap: esp32.cpu1 tap/device found: 0x120034e5 (mfg: 0x272 (Tensilica), part: 0x2003, ver: 0x1)
JTAG tap: esp32.cpu1 tap/device found: 0x120034e5 (mfg: 0x272 (Tensilica), part: 0x2003, ver: 0x1)
cpu0: Current bits set: BreakIn BreakOut RunStallIn
cpu0: Current bits set: BreakIn BreakOut RunStallIn
cpu1: Current bits set: BreakIn BreakOut RunStallIn
cpu1: Current bits set: BreakIn BreakOut RunStallIn
Info : esp32: Debug controller was reset (pwrstat=0x5F, after clear 0x0F).
Info : esp32: Core was reset (pwrstat=0x5F, after clear 0x0F).
esp32: Debug controller was reset (pwrstat=0x5F, after clear 0x0F).
esp32: Core was reset (pwrstat=0x5F, after clear 0x0F).
Info : Target halted. PRO_CPU: PC=0x5000004B (active)    APP_CPU: PC=0x00000000
Target halted. PRO_CPU: PC=0x5000004B (active)    APP_CPU: PC=0x00000000
esp32: target state: halted
esp32: target state: halted
Info : esp32: Core was reset (pwrstat=0x1F, after clear 0x0F).
esp32: Core was reset (pwrstat=0x1F, after clear 0x0F).
Info : Target halted. PRO_CPU: PC=0x40000400 (active)    APP_CPU: PC=0x40000400
Target halted. PRO_CPU: PC=0x40000400 (active)    APP_CPU: PC=0x40000400
esp32: target state: halted
esp32: target state: halted
PlatformIO: Initialization completed
PlatformIO: Resume the execution to `debug_init_break = thb app_main`
Info : Target halted. PRO_CPU: PC=0x400D07AB (active)    APP_CPU: PC=0x400E0EB6
Target halted. PRO_CPU: PC=0x400D07AB (active)    APP_CPU: PC=0x400E0EB6
[New Thread 1073510412]
[New Thread 1073508512]
[New Thread 1073513068]
[New Thread 1073500720]
[New Thread 1073497452]
[New Thread 1073499248]
[New Thread 1073501852]
[Switching to Thread 1073506396]

Temporary breakpoint
1, app_main () at src/main.c:43
43	    xTaskCreate(&blink_task, "blink_task", configMINIMAL_STACK_SIZE, NULL, 5, NULL);
/builds/idf/crosstool-NG/.build/src/gdb-7.10/gdb/inline-frame.c:171: internal-error: inline_frame_this_id: Assertion `!frame_id_eq (*this_id, outer_frame_id)' failed.
A problem internal to GDB has been detected,
further debugging may prove unreliable.
Quit this debugging session?
(y or n) [answered Y; input not from terminal]

This is a bug, please report it.
  For instructions, see:
<http://www.gnu.org/software/gdb/bugs/>.


/builds/idf/crosstool-NG/.build/src/gdb-7.10/gdb/inline-frame.c:171: internal-error: inline_frame_this_id: Assertion `!frame_id_eq (*this_id, outer_frame_id)' failed.
A problem internal to GDB has been detected,
further debugging may prove unreliable.
Create a core file of GDB?
(y or n) [answered Y; input not from terminal]
Has anyone seen such a behaviour before? And how can i suppress the [answered Y; input not from terminal] so that i can test the debugger despite the error?
Thanks!

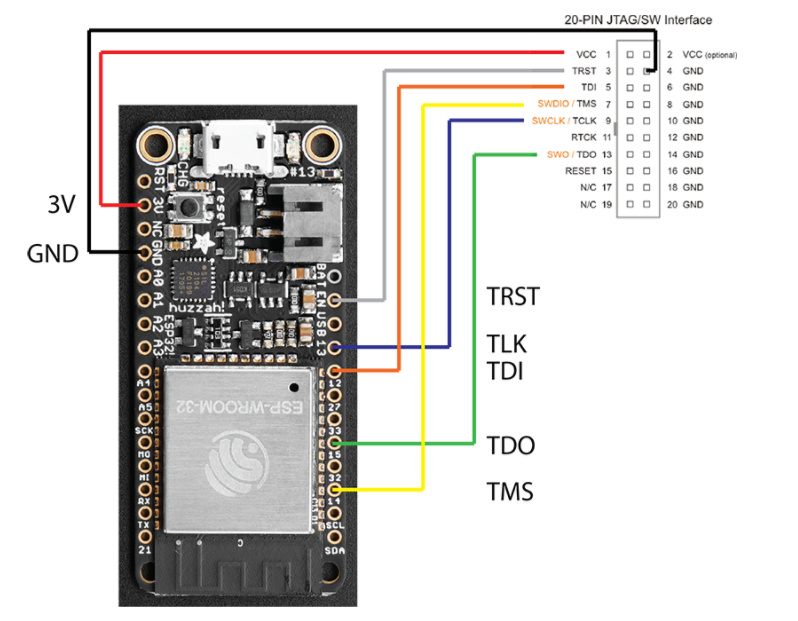
 Do you have Mac or Linux machine? Just to try if it works. You can even try to install VirtualBox + Ubuntu and check if it works on Linux. As minimum, we will know that your hardware is good and wires are connected correctly.