CLion / Avarice debug not working

A brief desciption of my situation:

I want to debug a Atmel ATmega 328P using an AVR Dragon. The hardware is working: I can successfully initiate a debugging session in Atmel Studio. I can also start a debug session using avarice (on linux), gdb and step through the code.

The debugger of PlatformIO (VSCode) is also working (albeing it not as stable as the previous two), but not on CLion. When the debug session is starting, the debugger is stuck on ‘Loading’ in the Thread-1 pane and ‘Collecting data’ on the Variables pane. After a few seconds, it crashes (or at least, the debug session stops, avarice keeps running in the background). A debug log:

Preparing firmware for debugging...
Processing uno (platform: atmelavr; board: uno; framework: arduino)
--------------------------------------------------------------------------------
Verbose mode can be enabled via `-v, --verbose` option
CONFIGURATION: https://docs.platformio.org/page/boards/atmelavr/uno.html
PLATFORM: Atmel AVR (3.1.0) > Arduino Uno
HARDWARE: ATMEGA328P 16MHz, 2KB RAM, 31.50KB Flash
DEBUG: Current (custom) On-board (avr-stub, simavr)
PACKAGES: 
 - framework-arduino-avr 5.1.0 
 - toolchain-atmelavr 1.50400.190710 (5.4.0)
LDF: Library Dependency Finder -> http://bit.ly/configure-pio-ldf
LDF Modes: Finder ~ chain, Compatibility ~ soft
Found 5 compatible libraries
Scanning dependencies...
No dependencies
Building in debug mode
Checking size .pio/build/uno/firmware.elf
Advanced Memory Usage is available via "PlatformIO Home > Project Inspect"
RAM:   [=         ]  11.4% (used 234 bytes from 2048 bytes)
Flash: [=         ]   8.2% (used 2632 bytes from 32256 bytes)
========================= [SUCCESS] Took 0.27 seconds =========================
Reading symbols from /home/WirePirate/CLionProjects/untitled/.pio/build/uno/firmware.elf...done.
PlatformIO Unified Debugger -> http://bit.ly/pio-debug
PlatformIO: debug_tool = custom
PlatformIO: Initializing remote target...
0x00000000 in __vectors ()
PlatformIO: Initialization completed
warning: Can not parse XML memory map; XML support was disabled at compile time
PlatformIO: Resume the execution to `debug_init_break = tbreak main`
PlatformIO: More configuration options -> http://bit.ly/pio-debug

And my platformio.ini:

[env:uno]
platform = atmelavr
board = uno
upload_protocol = dragon_isp
framework = arduino
upload_flags = "-e"
board_upload.require_upload_port = false
debug_server =
    avarice
    --dragon
    --debugwire
    :4242
debug_tool = custom
debug_port = :4242
debug_init_cmds =
    target remote $DEBUG_PORT
debug_load_cmds =
    file "$PROG_PATH"
    file /home/WirePirate/CLionProjects/untitled/.pio/build/uno/firmware.elf
    load

This is the same config used to run the debug session in VSCode. If anyone has a hint, I’m eager to hear it. Since it is even working in VSCode, this is propably a PlatformIO bug.
If you keep this value empty with debug_server = and just open it in an own shell before you start debugging, you should be able to see the avarice output and whether it crashes. If that’s the case → bugreport to them.

Avarice doesn’t crash. It looks like GDB keeps on reading massive chunks of data (GDB: Read x bytes from 0x0001), the latter keeping increasing. VSCode output looks largely the same, except that in the case of CLion empty frames are returned and VSCode seems to get actual data.

This is not an avarice issue.

Okay then try the following:

Add the line

build_type = debug 

to the platformio.ini. Rebuild and upload the project as normal via “Upload”.

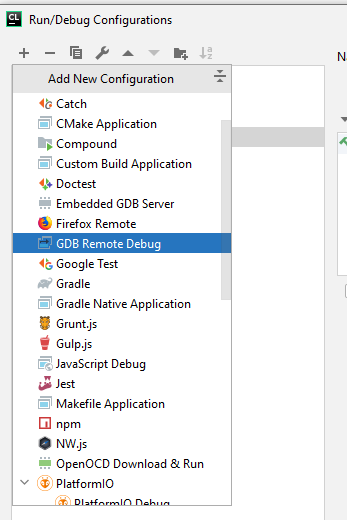
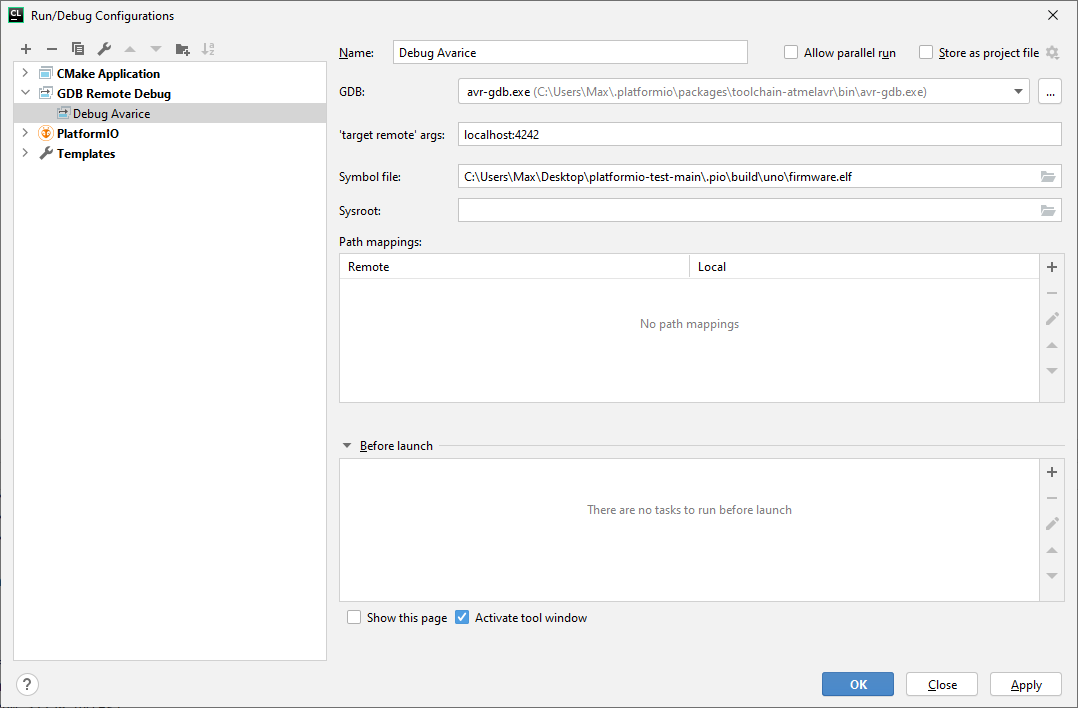
In the top right corner for the run configuration, click “Edit configurations”. Add a “GDB Remote Debug” configuration.

Configure the GDB path to be the AVR-GDB in the PlatformIO toolchain folder, localhost:4242 and the ELF file of the firmware

Start your avarice server locally in a shell again.

Click on the “Debug” icon in the top right corner in CLion.

Does GDB connect? Can you halt the chip? Can you step through the code?

1 Like

Yes! It’s working using the steps you described, thanks for your effort. Really appreciated!

Back to the original question though: it now really looks like a PIO issue, like I suspected before.

Edit: I might point out that ‘working’ means: connected to the debugger, the ability to halt the code and step through the code.

1 Like

This seems kinda suspicious to me though. Why load two files?

You might want to retry with the PIO debugger again but

  • use debug_load_mode = manual (docs), which is possible if you set build_type = debug and upload the firmware beforehand
  • remove one file command with the hardcoded path in debug_load_cmds or try an empty value
  • try writing localhost:4242 instead of :4242 everywhere

Otherwise I don’t know where the error could possibly be, since you’ve confirmed it working with PlatformIO’s bundled avr-gdb version and your avarice version.

PS: Instead of a “GDB remote debug” you can also choose an “Embedded GDB server” configuration where you can directly write the avarice invocation, too. No need to open it in a second shell then, autostarted and autoclosed.

Tried the things you mentioned, but it didn’t help.

This appears in the ‘PlatformIO Debug (disassembly)’ pane:

! Debugger was unable to disassemble function containing address 0x00000000fffffffe: Cannot access memory at address 0xfffffbfe

Reading symbols from /home/WirePirate/CLionProjects/untitled/.pio/build/uno/firmware.elf...done.
PlatformIO Unified Debugger -> http://bit.ly/pio-debug
PlatformIO: debug_tool = custom
PlatformIO: Initializing remote target...
Error during pretty printers setup: Undefined info command: "pretty-printer".  Try "help info".

Some features and performance optimizations will not be available.

0xfffffffe in ?? ()
PlatformIO: Initialization completed
warning: Can not parse XML memory map; XML support was disabled at compile time
PlatformIO: Resume the execution to `debug_init_break = tbreak main`
PlatformIO: More configuration options -> http://bit.ly/pio-debug
pio_reset_run_target
Warning! Undefined pio_reset_run_target command
"monitor" command not supported by this target.

And the same thing as in the beginning: stuck on ‘Loading’ in the Thread-1 pane and ‘Collecting data’ on the Variables pane.

I’d actually recommend opening a ticket at https://youtrack.jetbrains.com/issues?q=tag:%20platformio regarding the CLion Plugin for PlatformIO. If the same platformio.ini works in VSCode’s PlatformIO’s integration but not in CLion’s PlatformIO integration, then CLion must be something differently. Maybe the problem also lies in the core (Issues · platformio/platformio-core · GitHub) but I’m unsure of that and if someone from the CLion side looks over that, more insights in that might be gained.

Otherwise I’m closing this as solved since CLion’s pre-existing debug configurations confirmed work with this even without PlatformIO.