My firmware and littleFS file system build and upload just fine to a esp32-s3 devkitc N16R8.
But after that my S3 goes into constant reboot and shows crazy GPIO assignments which don’t exist in my code:
rst:0x8 (TG1WDT_SYS_RST),boot:0x8 (SPI_FAST_FLASH_BOOT)
Saved PC:0x4037971c
SPIWP:0xee
mode:DIO, clock div:1
load:0x3fce3808,len:0x44c
load:0x403c9700,len:0xbe4
load:0x403cc700,len:0x2a38
entry 0x403c98d4
E (23) gpio: gpio_set_direction(274): GPIO number error
E (24) gpio: gpio_set_direction(274): GPIO number error
E (24) gpio: gpio_pullup_en(71): GPIO number error
E (27) gpio: gpio_pullup_en(71): GPIO number error
E (31) pcnt: _pcnt_unit_config(358): PCNT pulse input io error
E (37) pcnt: _pcnt_unit_config(358): PCNT pulse input io error
[   292][E][esp32-hal-gpio.c:102] __pinMode(): Invalid pin selected
E (48) gpio: gpio_set_level(226): GPIO output gpio_num error
ESP-ROM:esp32s3-20210327
Build:Mar 27 2021
Multiple sources say this can happen when you try to access pin “-1”, which in some libraries means “pin undefined”, but they still try to use it.
For example, with the LovyanGFX library
and you also set a pin to -1 here
Not saying that that’s the culprit, but “something” in either your code or a library seems to try to use either pin -1 or another invalid pin number in pinMode.
The good message is that the ESP32S3 has a built in USB-JTAG controller. So, if your development board’s USB port is directly connected to the ESP32S3, then you can actually start up the debugger in the VSCode Debug sidebar and press “Play” for the PIO Debug configuration. The default debug_tool for the board should already be esp-builtin.
What this will allow you to do is set a breakpoint in the __pinMode which throws that error message
by e.g. saying
debug_init_break = break esp32-hal-gpio.c:102
so that after the debugger starts, it keeps running until it hits that breakpoint in that line, which is where the error message is printed. The call stack in the debugger sidebar will then show you how execution has reached that location, immediately identifying the calling function and library, from which you can identify what’s wrong.
I commented out “cfg.pin_busy = -1;” but it didn’t change anything.
Meanwhile - for testing purposes - I have deactivated all encoder-peripherals and their use of GPIOs and those error messages disappeared…
…BUT: it still reboots and the monitor shows:
abort() was called at PC 0x40379297 on core 1


Backtrace: 0x40377b82:0x3fcca360 0x4037d641:0x3fcca380
0x40384111:0x3fcca3a0 0x40379297:0x3fcca420 0x403793a9:0x3fcca450
0x40379478:0x3fcca470 0x420b36f2:0x3fcca4a0 0x420b6719:0x3fcca7b0
0x420c8765:0x3fcca7e0 0x4206d61a:0x3fcca810 0x4206d6af:0x3fcca840
0x42046691:0x3fcca8c0 0x42033f0d:0x3fcca8f0 0x42033f9e:0x3fcca920
0x42006ac6:0x3fcca940 0x42006b5b:0x3fcca960 0x420187bc:0x3fcca990
0x42018f41:0x3fcca9e0 0x4201bce5:0x3fccaa00 0x4200702b:0x3fccaa30
Maybe, the underlying problems are still the GPIOs.
The output of xtensa-esp32s3-elf-addr2line.exe reads:
0x4037d641: esp_system_abort at /Users/ficeto/Desktop/ESP32/ESP32S2/esp-idf-public/components/esp_system/esp_system.c:137
0x40384111: abort at /Users/ficeto/Desktop/ESP32/ESP32S2/esp-idf-public/components/newlib/abort.c:46
0x40379297: lock_acquire_generic at /Users/ficeto/Desktop/ESP32/ESP32S2/esp-idf-public/components/newlib/locks.c:139
0x403793a9: _lock_acquire_recursive at /Users/ficeto/Desktop/ESP32/ESP32S2/esp-idf-public/components/newlib/locks.c:167
0x40379478: __retarget_lock_acquire_recursive at /Users/ficeto/Desktop/ESP32/ESP32S2/esp-idf-public/components/newlib/locks.c:323 (discriminator 3)
0x420b4232: phy_i2c_init2 at ??:?
0x420b7259: __cxxabiv1::__si_class_type_info::__do_dyncast(int, __cxxabiv1::__class_type_info::__sub_kind, __cxxabiv1::__class_type_info const*, void const*, __cxxabiv1::__class_type_info const*, void const*, __cxxabiv1::__class_type_info::__dyncast_result&) const at /builds/idf/crosstool-NG/.build/HOST-x86_64-w64-mingw32/xtensa-esp32s3-elf/src/gcc/libstdc++-v3/libsupc++/si_class_type_info.cc:59
0x420c92d5: __ssvfiscanf_r at /builds/idf/crosstool-NG/.build/HOST-x86_64-w64-mingw32/xtensa-esp32s3-elf/src/newlib/newlib/libc/stdio/vfscanf.c:649 (discriminator 1)
0x4206d9d6: tcp_create_segment at /Users/ficeto/Desktop/ESP32/ESP32S2/esp-idf-public/components/lwip/lwip/src/core/tcp_out.c:168 (discriminator 2)
0x4206da6b: tcp_create_segment at /Users/ficeto/Desktop/ESP32/ESP32S2/esp-idf-public/components/lwip/lwip/src/core/tcp_out.c:201
0x42046a4d: AsyncWebSocketResponse::_respond(AsyncWebServerRequest*) at C:\Pio_projects\CNCpanel-LinuxCNC-Ethercat-ESP32-ESPnow/.pio/libdeps/esp3/ESPAsyncWebServer/src/AsyncWebSocket.cpp:1223
 (inlined by) AsyncWebSocketResponse::_respond(AsyncWebServerRequest*) at C:\Pio_projects\CNCpanel-LinuxCNC-Ethercat-ESP32-ESPnow/.pio/libdeps/esp3/ESPAsyncWebServer/src/AsyncWebSocket.cpp:1221
0x420341d9: lv_bin_decoder_info at C:\Pio_projects\CNCpanel-LinuxCNC-Ethercat-ESP32-ESPnow/.pio/libdeps/esp3/lvgl/src/libs/bin_decoder/lv_bin_decoder.c:123
0x4203426a: fs_read_file_at at C:\Pio_projects\CNCpanel-LinuxCNC-Ethercat-ESP32-ESPnow/.pio/libdeps/esp3/lvgl/src/libs/bin_decoder/lv_bin_decoder.c:1088
0x42006b46: setup() at C:\Pio_projects\CNCpanel-LinuxCNC-Ethercat-ESP32-ESPnow/src/esp3/main_esp3.cpp:134
 (inlined by) setup() at C:\Pio_projects\CNCpanel-LinuxCNC-Ethercat-ESP32-ESPnow/src/esp3/main_esp3.cpp:72
0x42006bff: setup() at C:\Pio_projects\CNCpanel-LinuxCNC-Ethercat-ESP32-ESPnow/src/esp3/main_esp3.cpp:168
 (inlined by) setup() at C:\Pio_projects\CNCpanel-LinuxCNC-Ethercat-ESP32-ESPnow/src/esp3/main_esp3.cpp:74
0x42018a88: get_glyph_dsc_id at C:\Pio_projects\CNCpanel-LinuxCNC-Ethercat-ESP32-ESPnow/.pio/libdeps/esp3/lvgl/src/font/lv_font_fmt_txt.c:299
0x4201920d: indev_proc_short_click at C:\Pio_projects\CNCpanel-LinuxCNC-Ethercat-ESP32-ESPnow/.pio/libdeps/esp3/lvgl/src/indev/lv_indev.c:1542
0x4201bfb1: lv_color_over32 at C:\Pio_projects\CNCpanel-LinuxCNC-Ethercat-ESP32-ESPnow/.pio/libdeps/esp3/lvgl/src/misc/lv_color_op.c:109
0x42007273: ArduinoJson::V704PB2::detail::parseNumber(char const*, ArduinoJson::V704PB2::detail::VariantData&) at C:\Pio_projects\CNCpanel-LinuxCNC-Ethercat-ESP32-ESPnow/.pio/libdeps/esp3/ArduinoJson/src/ArduinoJson/Numbers/parseNumber.hpp:101
0x42045615: WiFiGenericClass::mode(wifi_mode_t) at C:/Users/Maasen.KHV-NB-MZ37/.platformio/packages/framework-arduinoespressif32/libraries/WiFi/src/WiFiGeneric.cpp:701
 (inlined by) espWiFiStop at C:/Users/Maasen.KHV-NB-MZ37/.platformio/packages/framework-arduinoespressif32/libraries/WiFi/src/WiFiGeneric.cpp:735
 (inlined by) WiFiGenericClass::mode(wifi_mode_t) at C:/Users/Maasen.KHV-NB-MZ37/.platformio/packages/framework-arduinoespressif32/libraries/WiFi/src/WiFiGeneric.cpp:1153
I just updated my repo with all my changes.
I’ll have to research the debug thing. As I said: I’m a noob, I do all this with AI as an excercise and because it’s fun…
…sometimes
…not right now, actually,
I know I say it again and again, but: thanks!! Again!
The crash looks worse than before. Also, removing cfg.pin_busy = -1; leaves that variable uninitialized, meaning it has an unpredictable value. That might be even worse.
Try to use the debugger as described to get the offending call to pinMode. Things will become much clearer then.
Hmmm…in other working configs I saw this parameter was simply ommitted. I guess, debugging is the most promising route.
I will read a bit and if I’m lucky I’ll understand enough to setup the debugging. Somehow I think, it will turn out to be something very simple and maybe even unexpected.
I checked the GPIOs so often already…
But I’ve been going in circles for so long now. It’s time for a more structured approach.
undefinedC:\Users\Maasen.KHV-NB-MZ37\.platformio\packages\toolchain-xtensa-esp32s3\bin\xtensa-esp32s3-elf-gdb.exe: warning: Couldn't determine a path for the index cache directory.
Reading symbols from C:\Pio_projects\CNCpanel-LinuxCNC-Ethercat-ESP32-ESPnow\.pio\build\esp3\firmware.elf...
PlatformIO Unified Debugger -> https://bit.ly/pio-debug
PlatformIO: debug_tool = esp-builtin
PlatformIO: Initializing remote target...
Open On-Chip Debugger v0.11.0-esp32-20220706 (2022-07-06-15:48)
Licensed under GNU GPL v2
For bug reports, read
http://openocd.org/doc/doxygen/bugs.html
Info : only one transport option; autoselect 'jtag'
Info : esp_usb_jtag: VID set to 0x303a and PID to 0x1001
Info : esp_usb_jtag: capabilities descriptor set to 0x2000
adapter speed: 40000 kHz
Warn : Transport "jtag" was already selected
adapter speed: 5000 kHz
Info : tcl server disabled
Info : telnet server disabled
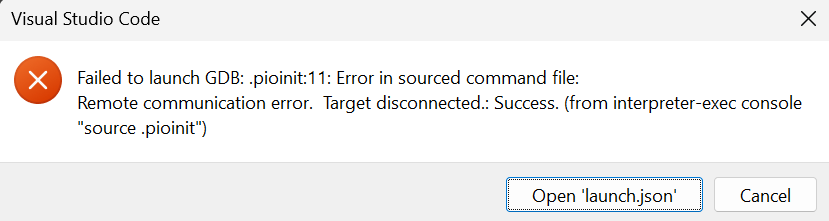
Error: libusb_open() failed with LIBUSB_ERROR_NOT_FOUND
Error: esp_usb_jtag: could not find or open device!
.pioinit:11: Error in sourced command file:
Remote communication error. Target disconnected.: Success.
This usually means that WinUSB or LibUSB aren’t installed for the USB JTAG interface and thus OpenOCD couldn’t access it. Can you try both WinUSB and LibUSB for this section?
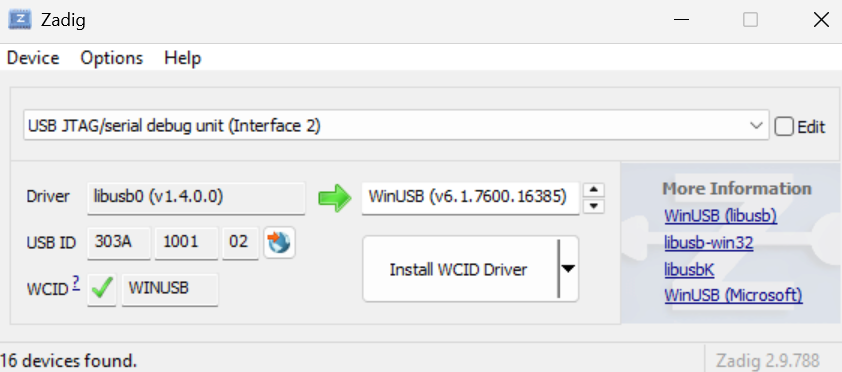
Still in ZADIG, select “USB Jtag/serial debug unit (interface 2)”, change the current driver to “WinUSB” and install by clicking the “Update Driver” button in Zadig.
Just to be on the safe side: I connect the left (=USB) port and with this one connection I install both drivers for “USB Jtag/serial debug unit (interface 1[and 2])”.
Meaning: I do not switch ports on the S3 in between driver up-/downgrades, correct?
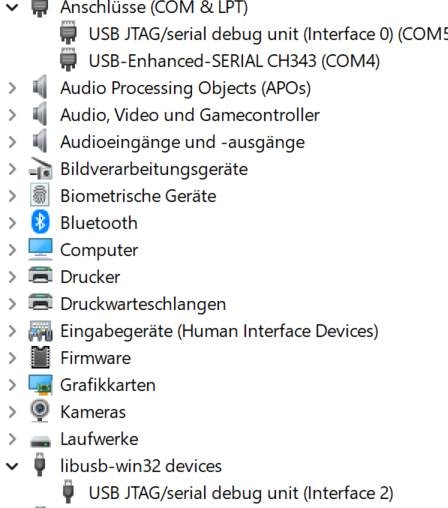
I chose libUSB for interface 2, driver installed successfully.
Very weird. The device list looks good. And I guess it’s the same when using WinUSB?
Can you try this procedure?
Press the “Upload” button and see that it uploads correctly
Check that you still have the “USB JTAG/serial debug unit” device in your device manager present. If not, reboot the board into bootloader mode (BOOT button held, EN button pressed and released, BOOT button released)
In the debug sidebar, switch from using the “PIO Debug” to “PIO Debug (without uploading)” (since the program is already uploaded) and start it. Does that connect?
Update:
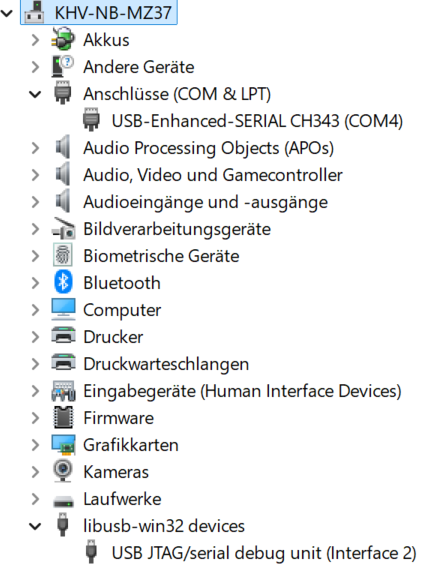
I even de-installed the libusb-win32 device and installed WinUSB again on interface 2 using a different cable and port. After resetting and putting the S3 into bottloader mode: still the same in Zadic and in device manager…
In the Windows device manager, you can use “View → Device by Container” to get a grouping of all USB interfaces that the ESP32-S3 provides. You can rightclick and uninstall (with the “remove device driver” ticked) on any interface and plug the device out and back in, to get back to default drivers.
Thanks (for XXX-th time)!
I closed Zadig and opened it again and re-did the whole driver install-procedure.
I used WinUSB for interface 2, again.
Device manager shows both Com-ports again.
Debug works.
Have to start understanding how to use it now and hunt down the problems…see in a year from now I guess.
See if you can directly use that to make the initial breakpoint in the problematic __pinMode function. (You can also set breakpoints manually by clicking on the line number of an opened file).
If you manage to set the breakpoint per above where it hits the “Invalid pin selected” print statement, then you can post a screenshot of the “Call Stack” in the left debug sidebar, and it should point to the problem as you walk up the call stack (you can click on any function in the call stack to see the “history” of how execution got there).
I think
also teaches some of the basics on how to use the debugger (breakpoints, watches, call stack, GDB commands, …)
Install the filter in the monitor that will decode the entire crash for you. Reference: pio device monitor — PlatformIO v6.1 documentation if you’re using platformio monitor. There’s a similar one for idf.py monitor if ou’re using that.
Then you can see the entire call tree where you’ll surely find something called something that tried to grab a lock at an inopportune time. Maybe you did something crazy like tried to write to a serial console while in an interrupt handler. (The serial console might need interrupts itself…) That would have stood out if you saw the entire trace.