How to use JTAG built-in debugger of the ESP32-S3 in PLATFORMIO
Most of the internet examples are showing using the ESP32-S3 built-in debugger in ESP-IDF, but I´m going showing how to do it in VSC PLATFORMIO.
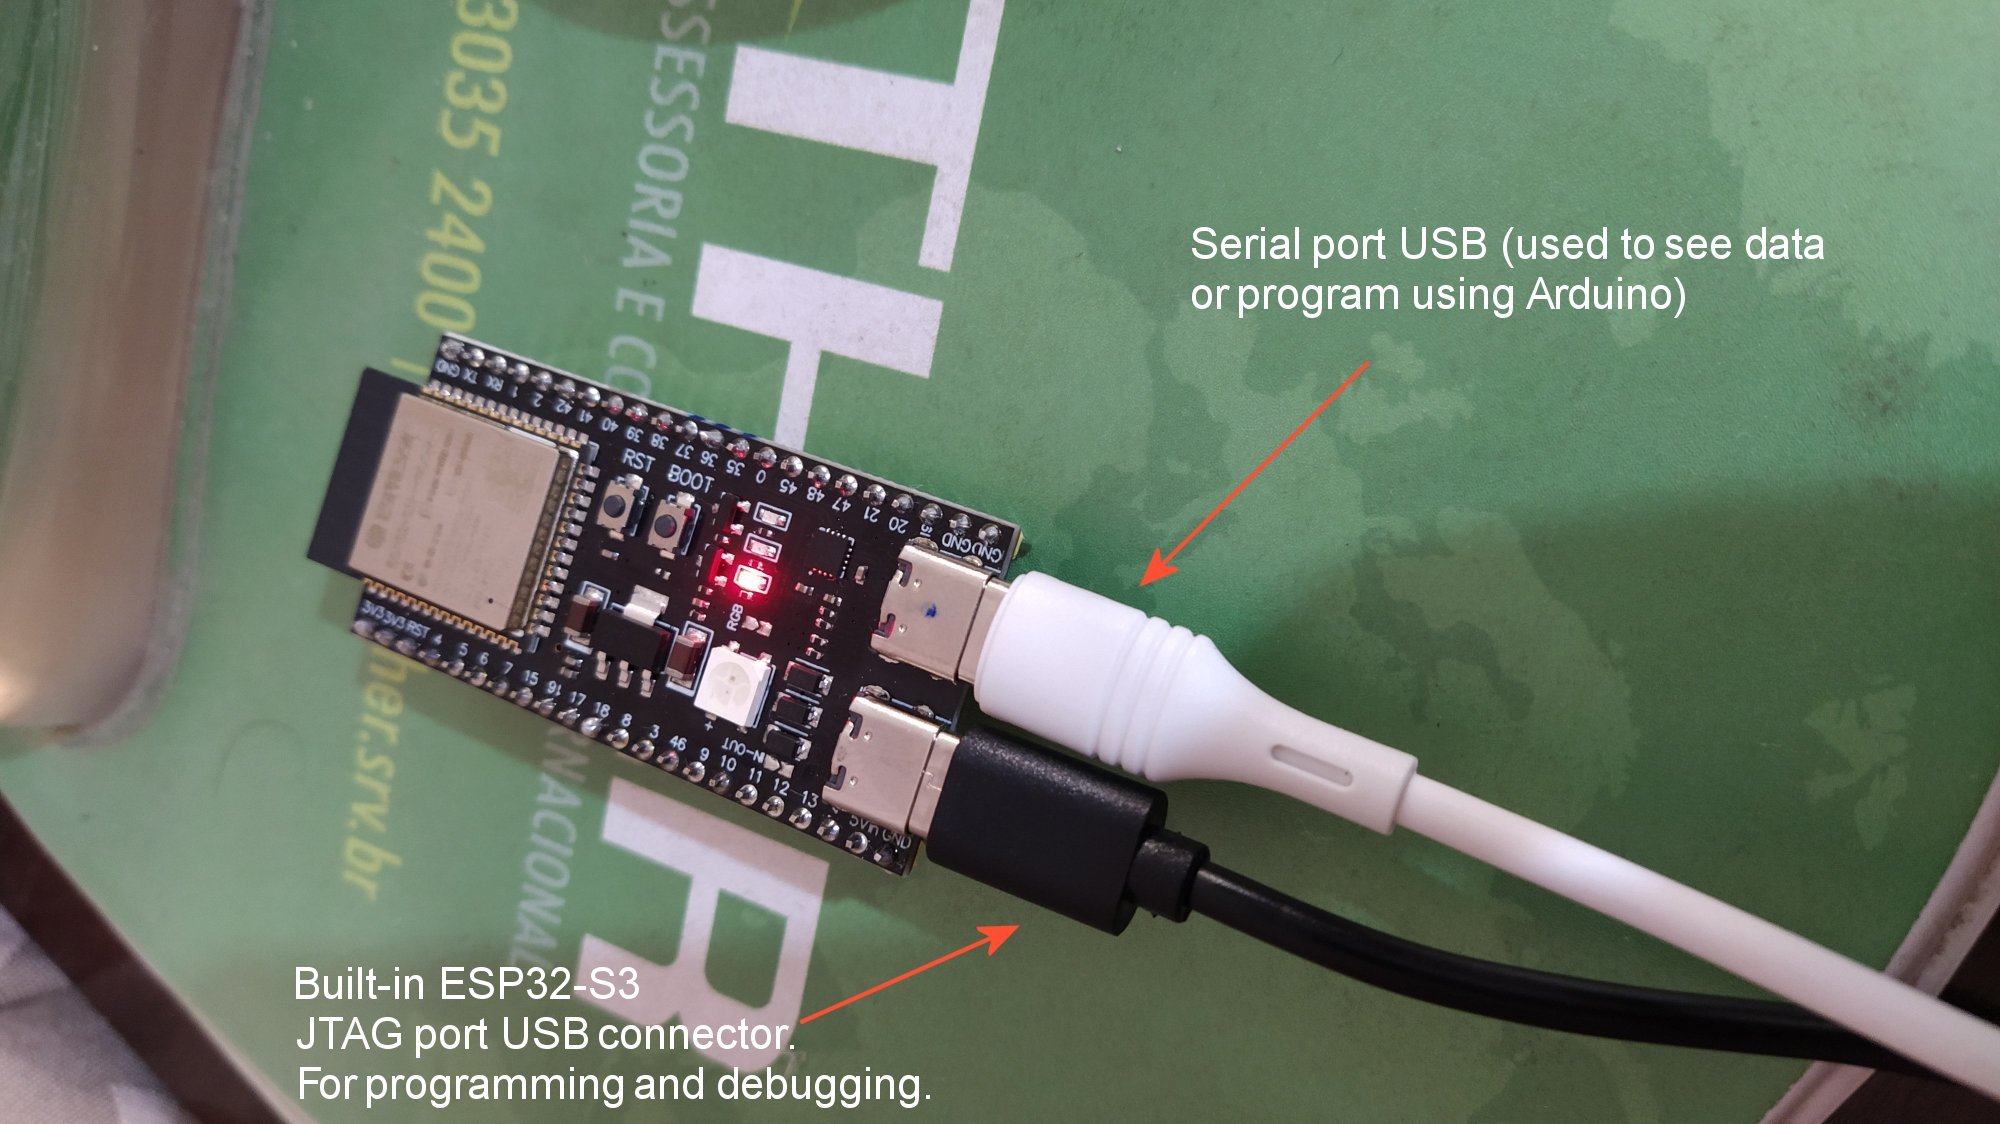
Uses the ESP32-S3’s own USB port to upload the firmware and debug the software on the PLATFORMIO. Allows you to use the standard serial port on the ESP card/recorder for normal serial communication at the same time.
The video below is very complete and explains how to configure the ESP32-S3’s Embedded Debuger on PLATFORMIO. There are a lot of things on the internet, but this is the only way it worked for me in PLATFORMIO.
https://www.youtube.com/watch?v=HGB9PI3IDL0
It is possible to program and debug directly via the ESP32-S3’s NATIVE USB, without the need to connect the ESP32 via the main USB connector. However, it is interesting to have the main USB connection in order to receive serial communication from the ESP32 on the Platformio Terminal. Thus, we will have information from ESP32-S3 JTAG and via the serial directly in the terminal.
STEPS:
00-Download the Zadig 2.8 program here: https://zadig.akeo.ie
0-Connect the cable to the native USB of the ESP32-S3, it is through this port that the ESP recording and debugging will be done.
1-Download and open ZADIG, Options, List All Devices, Select “USB Jtag/serial debug unit (interface 0)”, change the current driver to “USB Serial (CDC)” and install by clicking the “Update Driver” button on the Zadig.
2-Still in ZADIG, select “USB Jtag/serial debug unit (interface 2)”, change the current driver to “WinUSB” and install by clicking the “Update Driver” button in Zadig.
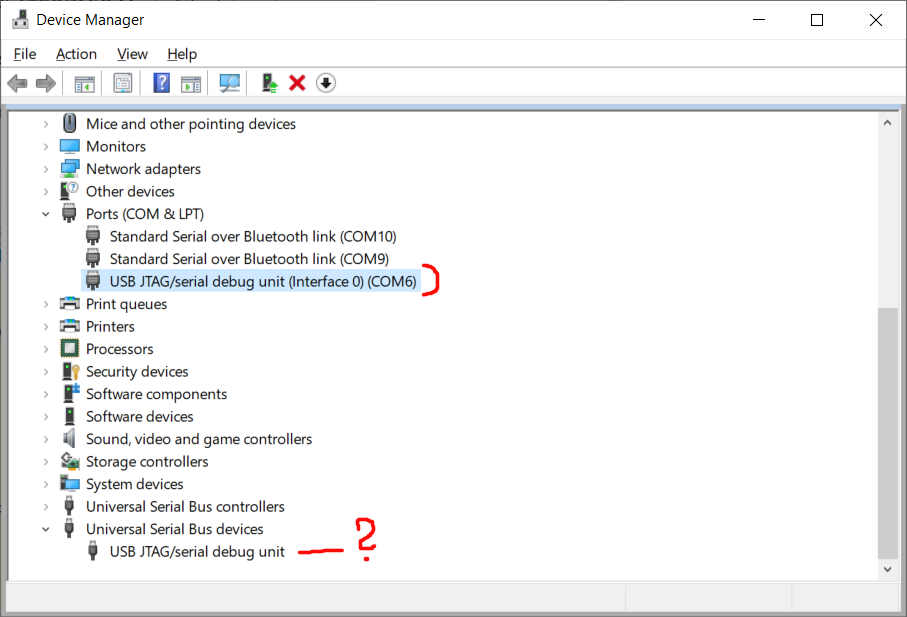
3-Open the Windows device manager to find out which ports to configure, in my case COM14 is JTAG(“USB-JTAG/serial debug unit(Interface 0)”) and COM10 is the standard serial of the ESP32 board- S3(“USB-Enhanced-SERIAL CH323”)
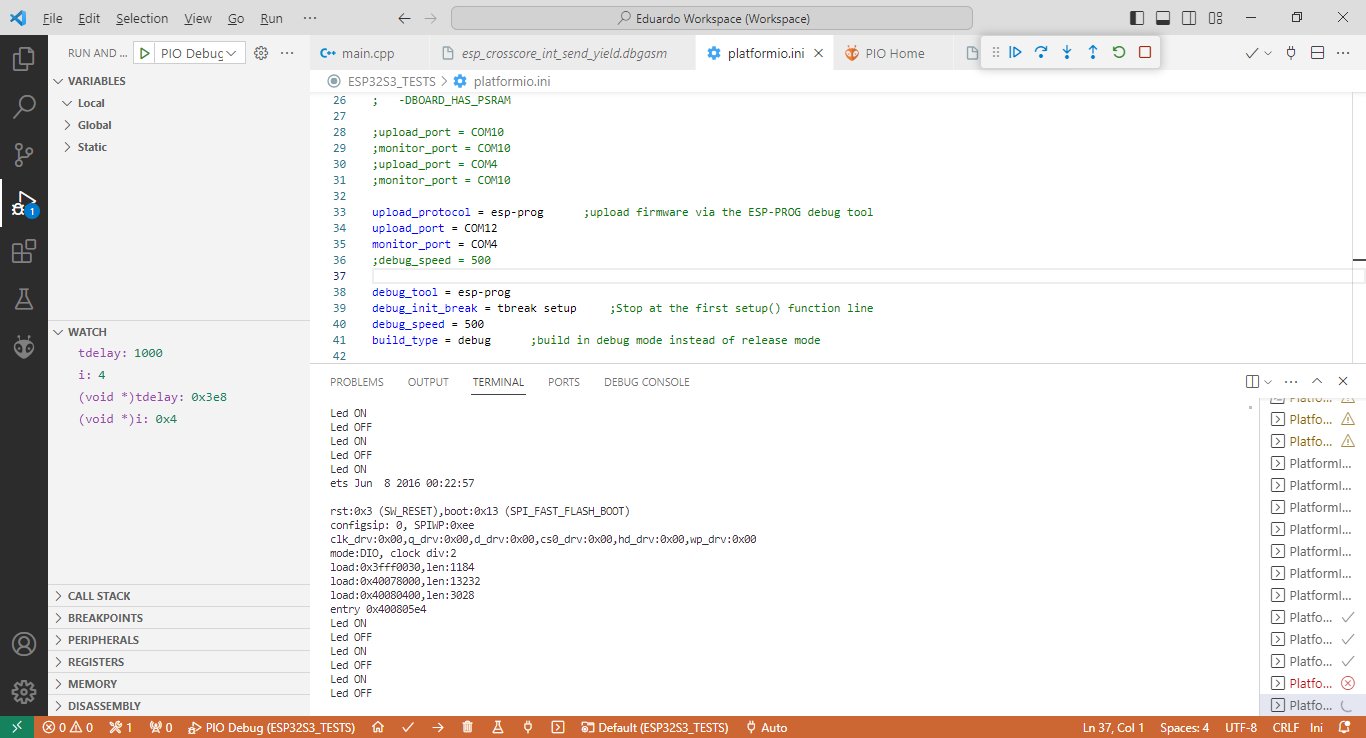
4-In Platformio, configure the Platformio.ini file. In the attached file, there is the port COM14(or the same port that appears in the Windows device manager as “USB-JTAG/serial debug unit(Interface 0)” for the JTAG Debugger, and COM10(or the same port that in Windows device manager appears as “USB-Enhanced-SERIAL CH323”) for the serial monitor. It is through the debugger that the code is also uploaded. This way, the Platformio.ini file would be configured as follows:
[env:esp32-s3-devkitc-1]
platform = https://github.com/platformio/platform-espressif32.git   ;Fech lastest support for ESP32
;platform = espressif32
board = esp32-s3-devkitc-1    ;ESP32-S3
framework = arduino
upload_speed = 2000000     ;ESP32S3 USB-Serial Converter maximum 2000000bps
upload_port = COM14
monitor_speed = 115200
monitor_port = COM10
debug_tool = esp-builtin
debug_init_break = break setup
build_type = debug      ;build in debug mode instead of release mode
IMPORTANT:
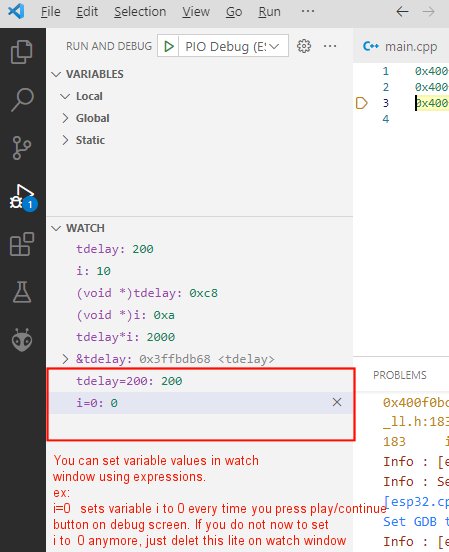
-HOW TO CHANGE VARIABLES DURING DEBUG. In the Watch_Window it is only possible to view variables. However, if you type the variable name = value, it is changed as soon as you run the code during debug.
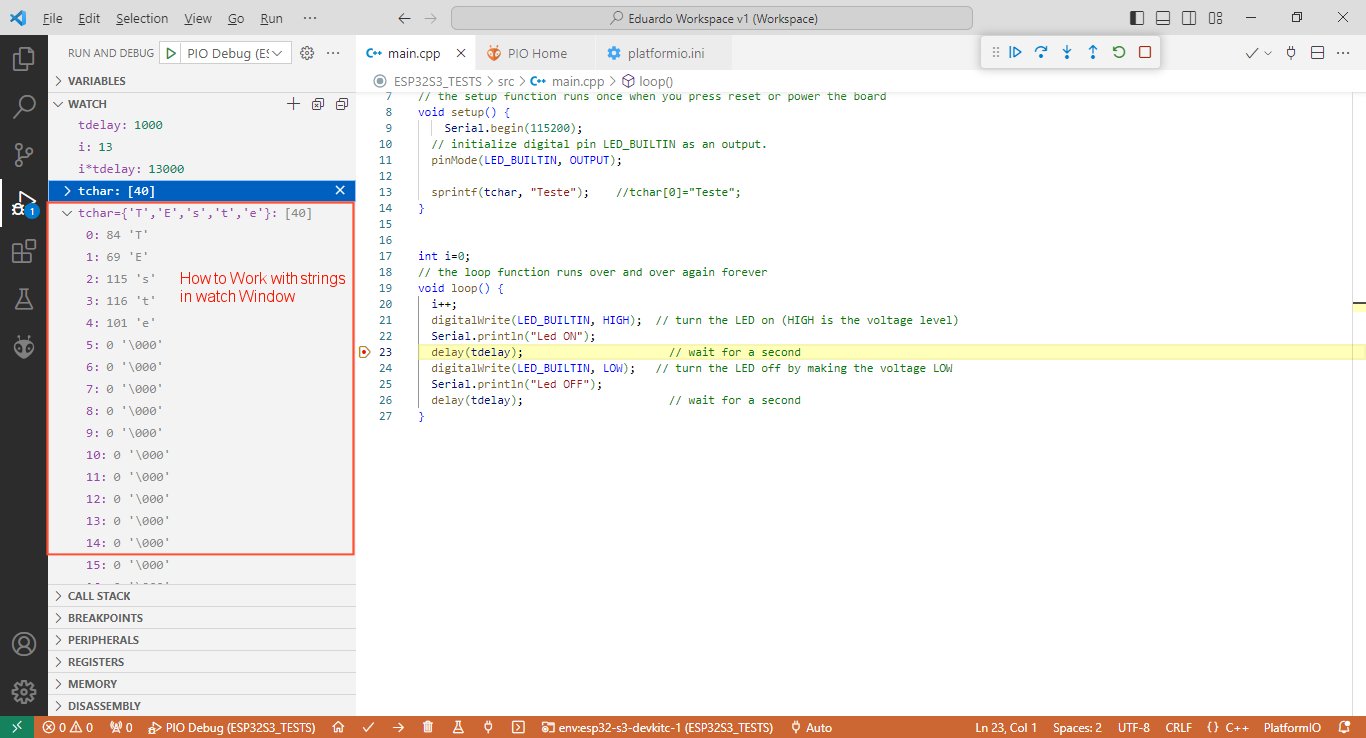
-Example changing String variable to “Eduardo ok”:
tchar={‘E’,‘d’,‘u’,‘a’,‘r’,‘d’,‘o’,’ ‘,‘o’,’ k’} : changes string value to “Eduardo ok”
-Before using ESP with the JTAG debugger, it is necessary to connect via normal USB and perform an ERASE FLASH. In PlatformIO itself there is the “Erase Flash” option. Otherwise, ESP can not work with JTAG, as the JTAG pins may be configured for something else.
-By clicking on the left side of the line number, Breakpoints are added. In watch we can view the variables, but to change their value, we need to locate them in the “VARIABLES” window. This is the worst part, as they are ordered in a confusing way and it is not possible to search, that is, changing the value of a variable in the PLATFORMIO debugger is rubbish, but the rest is very good, it is even possible to add a breakpoint on- the-go.
-In the Watch window, by typing (void )variable_name it is possible to view its value in HEX.
$pc : default decimal integer format
0x10012000 : an address, default decimal integer format
(void)$pc : $pc register, hexadecimal format
(void)0x10012000 : an address, hexadecimal format
&variable : shows variable pointing address
-It is possible to adjust variable format through DEBUG_CONSOLE:
set output-radix 16 : adjusts in HEX
set output-radix 10 : sets to decimal
set output-radix 8 : adjusts in octal
-It is possible to make calculations in the watch window. Ex:
var1*var2+4 : (the result appears)
Below the source file (main.c) of blink example program for debugging testing:
#include <Arduino.h>
#define LED_BUILTIN 2

long tdelay=1000;
char tchar[40];

// the setup function runs once when you press reset or power the board
void setup() {
    Serial.begin(115200);
  // initialize digital pin LED_BUILTIN as an output.
  pinMode(LED_BUILTIN, OUTPUT);

  sprintf(tchar, "Teste");    //tchar[0]="Teste";
}


int i=0;
// the loop function runs over and over again forever
void loop() {
  i++;
  digitalWrite(LED_BUILTIN, HIGH);  // turn the LED on (HIGH is the voltage level)
  Serial.println("Led ON");
  delay(tdelay);                      // wait for a second
  digitalWrite(LED_BUILTIN, LOW);   // turn the LED off by making the voltage LOW
  Serial.println("Led OFF");
  delay(tdelay);                      // wait for a second
}
Below some examples on using VSC PLATFORMIO debugger:
Watch Window and Serial Terminal:
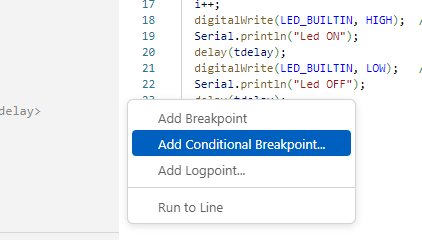
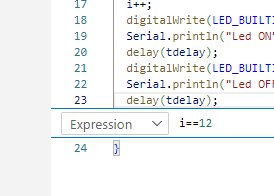
How to add conditional breakpoints:
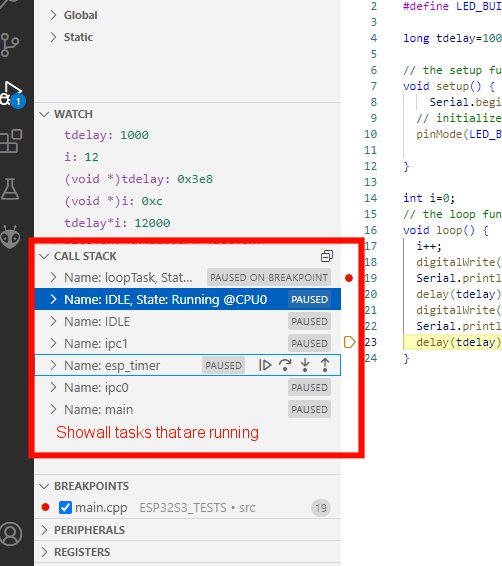
Show RTOS running tasks:
Changing variable values using watch window:
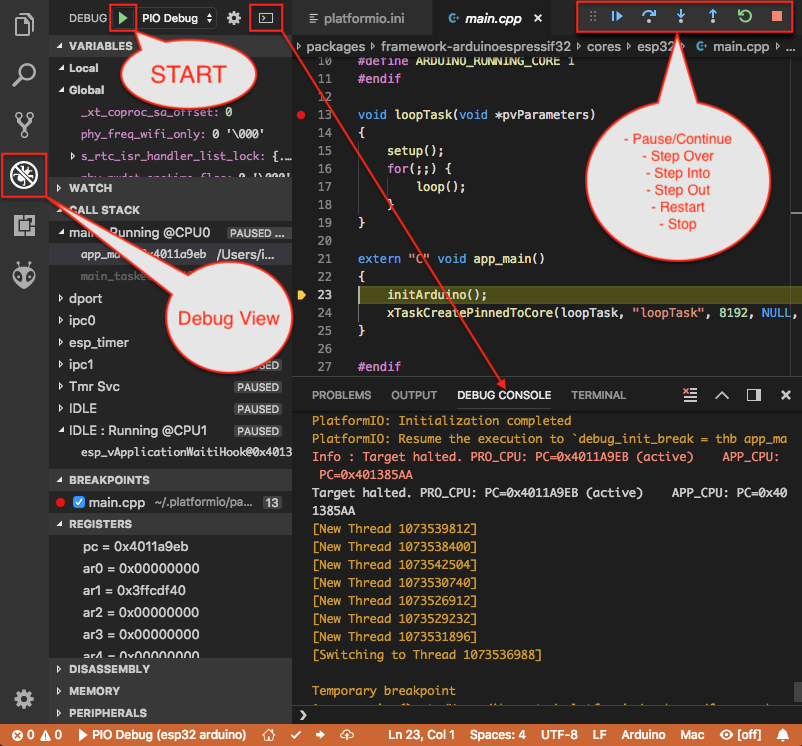
Debugger compiles, upload and runs F5 key (same as clicking Menu, Start debugging). I dig this image from another youtube video.
I hope it helps anyone that was struggling to debug ESP32-S3 in PLATFORMIO ![]()
![]()
![]()
![]()
![]()
![]()
![]()
![]()
![]()