Hello everyone,
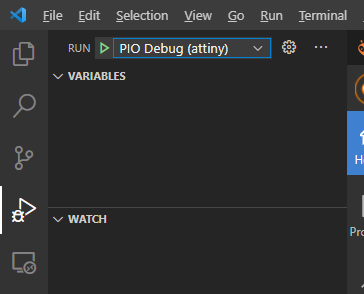
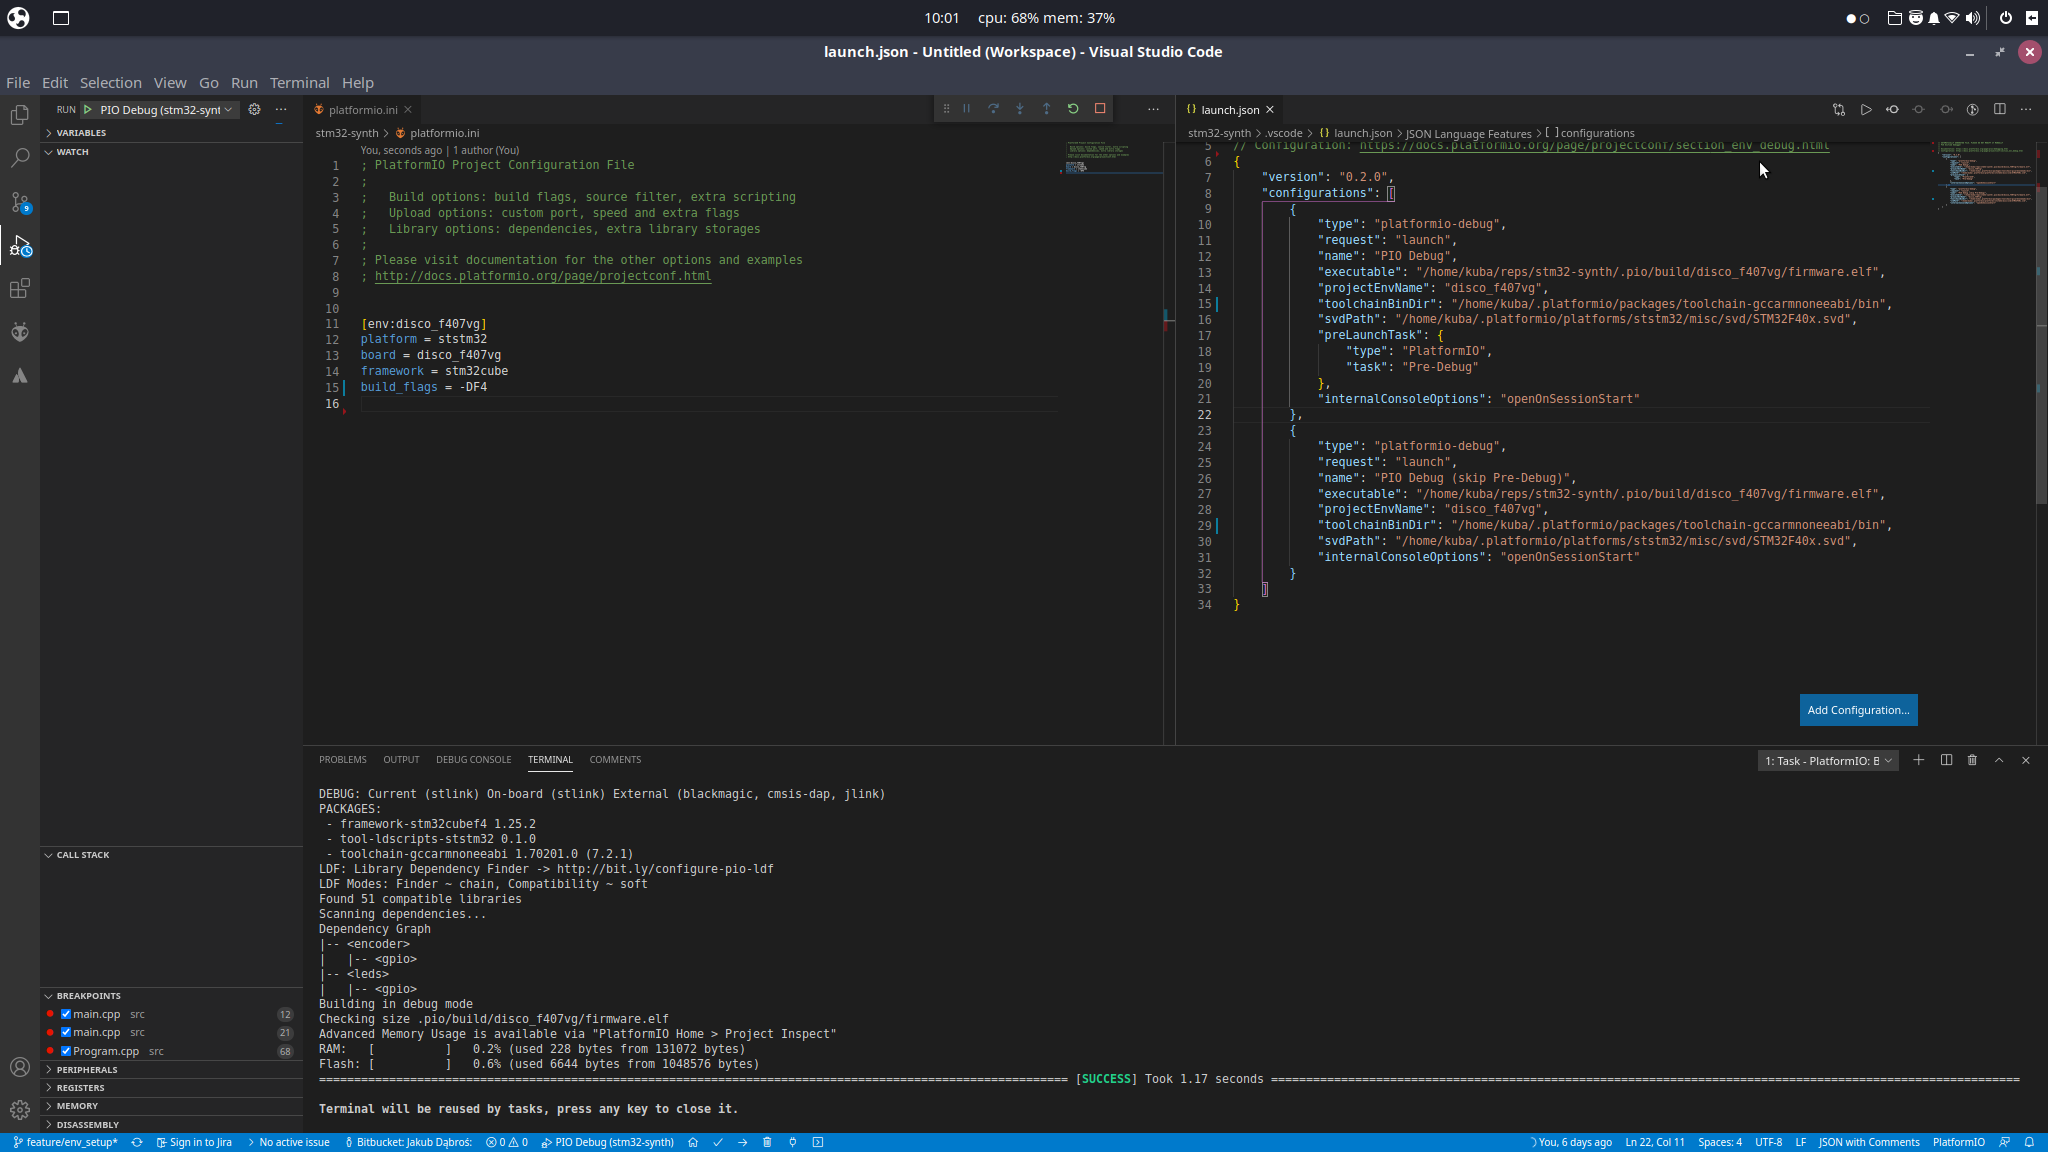
I’ve been trying to launch Platfotmio Unified Debugger for STM32F407VG Discovery board, via VS Code, using Run option (the one which uses launch.json). Unfortunately, after the upload, which goes just right, there is nothing more happening. Despite the fact that it is described as out of the box solution it is not launching at all. Don’t get me wrong, I do not want to complain, I am just trying to understand how to force it to run. 
I know for the fact that my computer env is working properly, as using
pio debug --interface=gdb -x .pioinit
works perfectly fine and starts gdb debug session. You may see the results pasted below:
Reading symbols from /home/kuba/reps/stm32-synth/.pio/build/disco_f407vg/firmware.elf...done.
PlatformIO Unified Debugger -> http://bit.ly/pio-debug
PlatformIO: debug_tool = stlink
PlatformIO: Initializing remote target...
xPack OpenOCD, x86_64 Open On-Chip Debugger 0.10.0+dev-00378-ge5be992df (2020-06-26-09:27)
Licensed under GNU GPL v2
For bug reports, read
        http://openocd.org/doc/doxygen/bugs.html
Info : The selected transport took over low-level target control. The results might differ compared to plain JTAG/SWD
srst_only separate srst_nogate srst_open_drain connect_deassert_srst

Info : tcl server disabled
Info : telnet server disabled
Info : clock speed 2000 kHz
Info : STLINK V2J36S0 (API v2) VID:PID 0483:3748
Info : Target voltage: 2.896161
Info : stm32f4x.cpu: hardware has 6 breakpoints, 4 watchpoints
Info : starting gdb server for stm32f4x.cpu on pipe
Info : accepting 'gdb' connection from pipe
target halted due to debug-request, current mode: Thread
xPSR: 0x61000000 pc: 0x08001078 msp: 0x2001ff80
Info : device id = 0x10016413
Info : flash size = 1024 kbytes
Info : flash size = 512 bytes
0x08001078 in HAL_GPIO_Init (GPIOx=0x2001ffa0, GPIO_Init=0x0)
    at /home/kuba/.platformio/packages/framework-stm32cubef4/Drivers/STM32F4xx_HAL_Driver/Src/stm32f4xx_hal_gpio.c:270
270             if((GPIO_Init->Mode & RISING_EDGE) == RISING_EDGE)
Info : Unable to match requested speed 2000 kHz, using 1800 kHz
Info : Unable to match requested speed 2000 kHz, using 1800 kHz
target halted due to debug-request, current mode: Thread
xPSR: 0x01000000 pc: 0x08003a48 msp: 0x20020000
Info : Unable to match requested speed 8000 kHz, using 4000 kHz
Info : Unable to match requested speed 8000 kHz, using 4000 kHz
Loading section .isr_vector, size 0x188 lma 0x8000000
Loading section .text, size 0x1bfc lma 0x8000188
Loading section .rodata, size 0x58 lma 0x8001d84
Loading section .ARM, size 0x8 lma 0x8001ddc
Loading section .init_array, size 0x4 lma 0x8001de4
Loading section .fini_array, size 0x4 lma 0x8001de8
Loading section .data, size 0x70 lma 0x8001dec
Info : Unable to match requested speed 2000 kHz, using 1800 kHz
Info : Unable to match requested speed 2000 kHz, using 1800 kHz
target halted due to debug-request, current mode: Thread
xPSR: 0x01000000 pc: 0x08001a44 msp: 0x20020000
Start address 0x8001a44, load size 7772
Transfer rate: 9 KB/sec, 1110 bytes/write.
Info : Unable to match requested speed 2000 kHz, using 1800 kHz
Info : Unable to match requested speed 2000 kHz, using 1800 kHz
Unable to match requested speed 2000 kHz, using 1800 kHz
Unable to match requested speed 2000 kHz, using 1800 kHz
target halted due to debug-request, current mode: Thread
xPSR: 0x01000000 pc: 0x08001a44 msp: 0x20020000
target halted due to debug-request, current mode: Thread
xPSR: 0x01000000 pc: 0x08001a44 msp: 0x20020000
Temporary breakpoint 1 at 0x8000930: file src/main.cpp, line 11.
PlatformIO: Initialization completed
(gdb) PlatformIO: Resume the execution to `debug_init_break = tbreak main`
PlatformIO: More configuration options -> http://bit.ly/pio-debug
Continuing.
Note: automatically using hardware breakpoints for read-only addresses.

Temporary breakpoint 1, main () at src/main.cpp:11
11        {
(gdb)
It does not really matter which platormio.ini setting I am trying to use, none of them seemed to help me.
Is there something obvious I am missing?
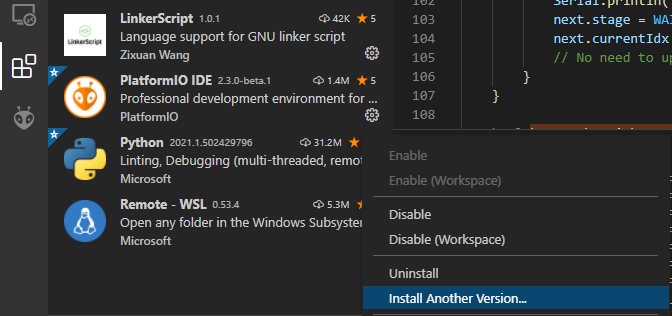
I’ve tried other debugging options from the extension marketplace and they worked (more or less).