OpenOCD JTAG ESP32-S2-Saola-1R embedding

Hello everybody,
i have to connect the ESP-prog jtag debugger, i have already done a lot and now i have to select the right configuration.

I entered this in the terminal

fabio@PC-Fabio /m/c/U/U/D/P/P/a/abiot-gateway (master) [1]> openocd -f board/esp32s2-saola-1.cfg
Open On-Chip Debugger 0.10.0
Licensed under GNU GPL v2
For bug reports, read
OpenOCD: Bug Reporting
embedded:startup.tcl:60: Error: Can’t find board/esp32s2-saola-1.cfg
in procedure ‘script’
at file “embedded:startup.tcl”, line 60
fabio@PC-Fabio /m/c/U/U/D/P/P/a/abiot-gateway (master) [1]> openocd -f board/esp32s2-saola-1R.cfg
Open On-Chip Debugger 0.10.0
Licensed under GNU GPL v2
For bug reports, read
OpenOCD: Bug Reporting
embedded:startup.tcl:60: Error: Can’t find board/esp32s2-saola-1R.cfg
in procedure ‘script’
at file “embedded:startup.tcl”, line 60
fabio@PC-Fabio /m/c/U/U/D/P/P/a/abiot-gateway (master) [1]> openocd -f target/esp32s2.cfg
Open On-Chip Debugger 0.10.0
Licensed under GNU GPL v2
For bug reports, read
OpenOCD: Bug Reporting
embedded:startup.tcl:60: Error: Can’t find target/esp32s2.cfg
in procedure ‘script’
at file “embedded:startup.tcl”, line 60
fabio@PC-Fabio /m/c/U/U/D/P/P/a/abiot-gateway (master) [1]>

Which configuration should I use?

Thank you

Open a CLI and execute

pio pkg exec -p tool-openocd-esp32 -c "openocd -f interface/ftdi/esp32_devkitj_v1.cfg -f target/esp32s2.cfg"

What does it say?

(esp32_devkitj_v1.cfg is used in the standard ESP-Prog case for ESP32 boards here, so the wireup at e.g. Low-cost ESP32 In-circuit Debugging | by Manuel Bl. | Medium should be correct. Otherwise, try esp32s2_kaluga_v1.cfg) .

pio --help
Welcome to fish, the friendly interactive shell
Type help for instructions on how to use fish
fabio@PC-Fabio /m/c/U/U/D/P/P/a/abiot-gateway (master)> pio --help

Command ‘pio’ not found, but there are 16 similar ones.

fabio@PC-Fabio /m/c/U/U/D/P/P/a/abiot-gateway (master) [127]> C:\Users\Utente.platformio\penv\Scripts[201~
C:: command not found
fish:
C:\Users\Utente.platformio\penv\Scripts[201~
^
fabio@PC-Fabio /m/c/U/U/D/P/P/a/abiot-gateway (master) [127]> pio pkg exec -p tool-openocd-esp32 -c “openocd -f interface/ftdi/esp32_devkitj_v1.cfg -f target/esp32s2.cfg”

Command ‘pio’ not found, but there are 16 similar ones.

fabio@PC-Fabio /m/c/U/U/D/P/P/a/abiot-gateway (master) [127]>

Are you doing in this in a WSL shell or something? You should do this where PlatformIO is installed, or expose the necessary PATH (Redirecting...).

Yeah sorry for my previous comment, pasted the wrong output.

Utente@PC-Fabio MINGW64 ~/.platformio/packages/tool-openocd-esp32
$ pio pkg exec -p tool-openocd-esp32 -c "openocd -f interface/ftdi/esp32_devkitj_v1.cfg -f target/esp32s2.cfg"
Using tool-openocd-esp32@2.1000.20210721 package
Open On-Chip Debugger  v0.10.0-esp32-20210721 (2021-07-21-13:35)
Licensed under GNU GPL v2
For bug reports, read
        http://openocd.org/doc/doxygen/bugs.html
adapter speed: 20000 kHz

Info : Listening on port 6666 for tcl connections
Info : Listening on port 4444 for telnet connections
Info : ftdi: if you experience problems at higher adapter clocks, try the command "ftdi_tdo_sample_edge falling"
Info : clock speed 20000 kHz
Info : JTAG tap: esp32s2.cpu tap/device found: 0x120034e5 (mfg: 0x272 (Tensilica), part: 0x2003, ver: 0x1)
Info : Listening on port 3333 for gdb connections

That seems to be successful. So I put it in platform.ini config as:

debug_tool = custom
debug_server =
 pio 
 pkg
 exec
 -p 
 tool-openocd-esp32 
 -c 
 "openocd -f interface/ftdi/esp32_devkitj_v1.cfg -f target/esp32s2.cfg"

But I only get (successful) build output and nothing past that (vscode debug stops). I also tried through cli pio debug --interface=gdb, and same thing, build output with no following errors:

Checking size .pio\build\abiot-gateway-arduinoesp32\firmware.elf
Advanced Memory Usage is available via "PlatformIO Home > Project Inspect"
RAM:   [=         ]  14.0% (used 45956 bytes from 327680 bytes)
Flash: [======    ]  63.9% (used 837910 bytes from 1310720 bytes)
Building .pio\build\abiot-gateway-arduinoesp32\firmware.bin
esptool.py v3.2
Merged 2 ELF sections
======================================================================================== [SUCCESS] Took 119.86 seconds ========================================================================================

Following some related suggestions you posted here ESP-Prog debugger issue. No visible error. (Ubuntu) - #22 by maxgerhardt

Started openocd in one shell, and gdb shell in another,

gdb:

(gdb) target extended-remote localhost:3333
Remote debugging using localhost:3333
0x40109516 in esp_pm_impl_waiti ()
    at /home/runner/work/esp32-arduino-lib-builder/esp32-arduino-lib-builder/esp-idf/components/hal/esp32s2/include/hal/cpu_ll.h:202
202     /home/runner/work/esp32-arduino-lib-builder/esp32-arduinol 
ib-builder/esp-idf/components/hal/esp32s2/include/hal/cpu_ll.h: No 
such file or directory.
(gdb)

Openocd:

Info : Listening on port 6666 for tcl connections
Info : Listening on port 4444 for telnet connections
Info : ftdi: if you experience problems at higher adapter clocks, try the command "ftdi_tdo_sample_edge falling"
Info : clock speed 20000 kHz
Info : JTAG tap: esp32s2.cpu tap/device found: 0x120034e5 (mfg: 0x272 (Tensilica), part: 0x2003, ver: 0x1)
Info : Listening on port 3333 for gdb connections
Info : accepting 'gdb' connection on tcp/3333
Warn : No symbols for FreeRTOS!
Info : esp32s2: Target halted, PC=0x40109516, debug_reason=00000000
Info : Detected ESP32-S2 chip
Info : esp32s2: Target halted, PC=0x40031F0C, debug_reason=00000001
Error: Failed to get flash maps (5)!
Warn : Failed to get flash mappings (-4)!
Info : esp32s2: Target halted, PC=0x40031F0C, debug_reason=00000001
Info : Auto-detected flash bank 'esp32s2.flash' size 0 KB
Info : Using flash bank 'esp32s2.flash' size 0 KB
Info : esp32s2: Target halted, PC=0x40031F0C, debug_reason=00000001
Error: Failed to get flash maps (5)!
Warn : Failed to get flash mappings (-4)!
Info : esp32s2: Target halted, PC=0x40031F0C, debug_reason=00000001
Info : Using flash bank 'esp32s2.irom' size 0 KB
Info : esp32s2: Target halted, PC=0x40031F0C, debug_reason=00000001
Error: Failed to get flash maps (5)!
Warn : Failed to get flash mappings (-4)!
Info : esp32s2: Target halted, PC=0x40031F0C, debug_reason=00000001
Info : Using flash bank 'esp32s2.drom' size 0 KB

Serial monitor:

Guru Meditation Error: Core  0 panic'ed (IllegalInstruction). Exception was unhandled.
Memory dump at 0x40031f08: 00000000 00000000 00000000
Setting breakpoint at 0x40031f0c and returning...

^ all those came when I connected gdb to openocd with target extended-remote localhost:3333

Regardless I tried monitor init and load in gdb after, and got:

(gdb) monitor init
(gdb) load
Loading section .flash.appdesc, size 0x100 lma 0x3f000020
Loading section .flash.rodata, size 0x1fbf8 lma 0x3f000120
Load failed
Openocd:
...
Warn : address 0x3f000020 not writable
Warn : address 0x3f000120 not writable

Any ideas what I am missing here? Thanks
Okay that in general is good, it sees the chip.

The clock speed may be too high though.

Instead of

Please write

debug_tool = custom
debug_server =
    ${platformio.packages_dir}/tool-openocd-esp32/bin/openocd
    -f
    interface/ftdi/esp32_devkitj_v1.cfg 
    -c
    adapter_khz 1000
    -f
    target/esp32s2.cfg

and retry debugging and post the output of the “Debug Console” tab.

Nothing :(.

Compiling .pio\build\abiot-gateway-arduinoesp32\FrameworkArduino\libb64\cencode.c.o
Compiling .pio\build\abiot-gateway-arduinoesp32\FrameworkArduino\main.cpp.o
Compiling .pio\build\abiot-gateway-arduinoesp32\FrameworkArduino\stdlib_noniso.c.o
Compiling .pio\build\abiot-gateway-arduinoesp32\FrameworkArduino\wiring_pulse.c.o
Compiling .pio\build\abiot-gateway-arduinoesp32\FrameworkArduino\wiring_shift.c.o
Archiving .pio\build\abiot-gateway-arduinoesp32\libFrameworkArduino.a
Linking .pio\build\abiot-gateway-arduinoesp32\firmware.elf
Retrieving maximum program size .pio\build\abiot-gateway-arduinoesp32\firmware.elf
Checking size .pio\build\abiot-gateway-arduinoesp32\firmware.elf
Advanced Memory Usage is available via "PlatformIO Home > Project Inspect"
RAM:   [=         ]  14.0% (used 45956 bytes from 327680 bytes)
Flash: [======    ]  63.9% (used 837910 bytes from 1310720 bytes)
Building .pio\build\abiot-gateway-arduinoesp32\firmware.bin
esptool.py v3.2
Merged 2 ELF sections
======================================================================================== [SUCCESS] Took 153.73 seconds ========================================================================================

Completes the build and nothing else happens. Is it supposed to upload as well? that is not happening

Also do I have to set upload_protocol to something?

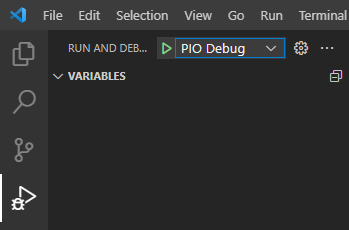
Did you start debugging via the play button in the debugging sidebar?

grafik

What’s the output in the “Debug Console” tab? (Not the “Terminal” tab)

Yes I started it using the launch config. First with “Pio Debug”, and also with “Pio Debug (without uploading)”

The First one prints build output in debug console, but nothing after that happens
The second one doesn’t print nothing, just starts and stops in 2 or so seconds

Try

debug_tool = custom
debug_server =
 pio 
 pkg
 exec
 -p 
 tool-openocd-esp32 
 -c 
 "openocd -f interface/ftdi/esp32_devkitj_v1.cfg -f target/esp32s2.cfg -c "adapter_khz 1000""

Like this?

[env:abiot-gateway-arduinoesp32]
platform = https://github.com/tasmota/platform-espressif32/releases/download/v2.0.2idf/platform-espressif32-2.0.2.zip
framework = arduino
board = esp32-s2-saola-1
lib_deps =
    knolleary/PubSubClient@^2.8
    vshymanskyy/TinyGSM@^0.11.4
    plerup/EspSoftwareSerial@^6.13.2
    xreef/EByte LoRa E32 library@^1.5.2
    adafruit/RTClib@^1.14.1
    nickgammon/Regexp@^0.1.0
    bblanchon/ArduinoJson@^6.18.5
    arduino-libraries/Ethernet@^2.0.0
    openslab-osu/SSLClient@^1.6.11
    ayushsharma82/AsyncElegantOTA@^2.2.6
    ottowinter/ESPAsyncWebServer-esphome@^2.1.0
upload_port = COM15
monitor_port = COM15
build_flags = -DCORE_DEBUG_LEVEL=ARDUHAL_LOG_LEVEL_DEBUG
; upload_protocol = esp-prog
; debug_tool = esp-prog
;debug_tool = custom
;debug_server =
;   ${platformio.packages_dir}/tool-openocd-esp32/bin/openocd
;    -f
;    interface/ftdi/esp32_devkitj_v1.cfg
;    -c
;    adapter_khz 1000
;    -f
;    target/esp32s2.cfg
 debug_tool = custom
; debug_port = localhost:3333
 debug_server =
  pio
  pkg
  exec
  -p
  tool-openocd-esp32
  -c
  "openocd -f interface/ftdi/esp32_devkitj_v1.cfg -f target/esp32s2.cfg -c "adapter_khz 1000""

Yes indeed. ------------

Mh after compilation…

*** [.pio\build\abiot-gateway-arduinoesp32\firmware.elf] Implicit dependency C:\Users\Utente\.platformio\platforms\espressif32@src-3a77011e7aaf379c12cf07f35d25002a\builder\debug_tool' not found, needed by target .pio\build\abiot-gateway-arduinoesp32\firmware.elf’.
========================= [FAILED] Took 111.84 seconds =========================

There is a space at the beginning of these lines that shouldn’t be there.

You mean “;”?
These lines are commented.

Of all these lines

 debug_tool = ..
 debug server = ..

Ok you’re right there was a formatting issue.

After I fixed it, no change at all. Vscode just debug doesn’t seem to work after build.

I tried setting debug_port = localhost:3333 in platformio.ini and starting openocd manually, however same result.
I could instead this time attach (manually from shell) successfully gdb to openocd and set a breakpoint when lowering the frequency like you suggested.

I’ve seen you opened this related issue on github Debugging does not start · Issue #2925 · platformio/platformio-vscode-ide · GitHub , you think it’d be related to my python version?

I also tried older version of pio extension, and disabled all unrelated extensions.

That issue was fixed long ago if you have an up-to-date extension version. Are there any extension updates available in VSCode?

Can you manually start the OpenOCD commad, then set

debug_tool = custom
debug_server = 
debug_port = localhost:3333

in the platformio.ini and start debugging? (i.e., you open the OpenOCD server, not PlatformIO)

VSCode (1.65.2) and the extension (2.4.2) are up to date.
Nope, no output in debug console after build. Seems like the only way to see an error printed is to put a wrong command in debug_server.

Too sad the extension’s debug side isn’t open source, it just makes it harder to troubleshoot. Any other ideas?