I am trying to debug the ESP32.
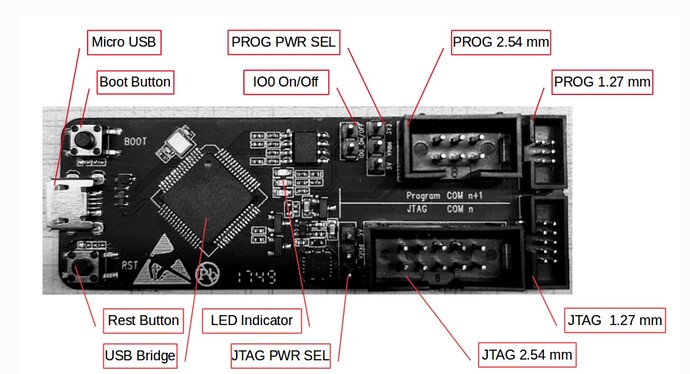
So I have an ESPPRog
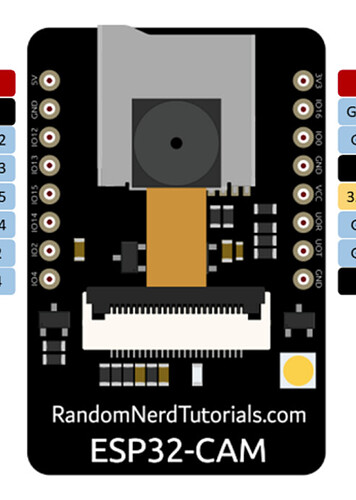
and have the programmer side connected to my ESP32 AI Thinker (with the minicamera)
I can upload a program using the ESPProg and the following setting in platformio
[platformio]
default_envs = esp32cam

[env:esp32cam]
upload_port = COM15
platform = https://github.com/platformio/platform-espressif32.git
board = esp32cam
framework = arduino
board_build.partitions = customparts.csv
build_flags = -mfix-esp32-psram-cache-issue
lib_deps = OneButton
monitor_port=COM15
monitor_speed = 115200
debug_tool = esp-prog
debug_init_break = tbreak setup

**upload_protocol = esptool**
So it uploads the program, and I then reset the ESP32 device and remove the Gnd wire connecting to IO0, and the program runs I can see output in the serial monitor.
Now to debug I click on PIO Debug (skip Pre-Debug) ESP32-RTP to debug my project without building and uploading - but I am getting this popup error dialog
[Window Title]
Visual Studio Code
Failed to launch GDB: .pioinit:11: Error in sourced command file:
Remote communication error. Target disconnected.: Success. (from interpreter-exec console “source .pioinit”)
And the output from the debugger is
Reading symbols from x:\3rdRepos\esp32\ESP32-RTSP\.pio\build\esp32cam\firmware.elf...
PlatformIO Unified Debugger -> https://bit.ly/pio-debug
PlatformIO: debug_tool = esp-prog
PlatformIO: Initializing remote target...
Open On-Chip Debugger  v0.11.0-esp32-20220411 (2022-04-11-08:48)
Licensed under GNU GPL v2
For bug reports, read
	http://openocd.org/doc/doxygen/bugs.html
adapter speed: 500 kHz

WARNING: boards/esp-wroom-32.cfg is deprecated, and may be removed in a future release.
DEPRECATED! use 'adapter speed' not 'adapter_khz'
adapter speed: 5000 kHz

Info : tcl server disabled
Info : telnet server disabled
Error: libusb_open() failed with LIBUSB_ERROR_NOT_SUPPORTED
Info : clock speed 5000 kHz
Info : JTAG tap: esp32.cpu0 tap/device found: 0x120034e5 (mfg: 0x272 (Tensilica), part: 0x2003, ver: 0x1)
Info : JTAG tap: esp32.cpu1 tap/device found: 0x120034e5 (mfg: 0x272 (Tensilica), part: 0x2003, ver: 0x1)
Info : esp32.cpu0: Debug controller was reset.
Info : esp32.cpu0: Core was reset.
Info : esp32.cpu0: Debug controller was reset.
Warn : target esp32.cpu1 examination failed
Info : starting gdb server for esp32.cpu0 on pipe
Info : accepting 'gdb' connection from pipe
Error: esp32.cpu0: DSR (80208413) indicates DIR instruction generated an exception!
Info : esp32.cpu0: Target halted, PC=0x4000904C, debug_reason=00000001
Info : Set GDB target to 'esp32.cpu0'
Warn : No symbols for FreeRTOS!
Error: esp32.cpu0: DSR (8000CC13) indicates DIR instruction generated an exception!
Warn : esp32.cpu0: Failed reading 9720 bytes at address 0x40090000
Error: no working area available, can't alloc space for stub code!
Error: Too many flash mappings 10414420! Must be 2.
Warn : Failed to get flash mappings (-4)!
Error: esp32.cpu0: DSR (8000CC13) indicates DIR instruction generated an exception!
Warn : esp32.cpu0: Failed reading 9720 bytes at address 0x40090000
Error: no working area available, can't alloc space for stub code!
Error: Failed to get flash size!
Error: esp32.cpu0: DSR (8000CC13) indicates DIR instruction generated an exception!
Warn : esp32.cpu0: Failed reading 9720 bytes at address 0x40090000
Error: no working area available, can't alloc space for stub code!
Error: Failed to get flash size!
Error: Failed to probe flash, size 0 KB
Error: auto_probe failed
Error: Connect failed. Consider setting up a gdb-attach event for the target to prepare target for GDB connect, or use 'gdb_memory_map disable'.
Error: attempted 'gdb' connection rejected
Error: error during select: Unknown error
.pioinit:11: Error in sourced command file:
Remote communication error.  Target disconnected.: Success.
I read in another post on here the **libusb_open() failed with LIBUSB_ERROR_NOT_SUPPORTED
** is a bug in oprnocd, as its opened the libusb ok to talk to the ESP32 and detect 2 cores etc.
It looks like its using the boards/esp-wroom-32.cfg
And the error is something to do with the flash area ?
Error: esp32.cpu0: DSR (8000CC13) indicates DIR instruction generated an exception!
Warn : esp32.cpu0: Failed reading 9720 bytes at address 0x40090000
Error: no working area available, can’t alloc space for stub code!
Error: Too many flash mappings 10414420! Must be 2.
Warn : Failed to get flash mappings (-4)!
Any help would be most appreciated !! Thanks.

