ESP32 PIO Debug GDB internal error with espidf projects

Hi all,
Having trouble getting PIO Unified Debugger to work.
Environment: VS Code on Win 10
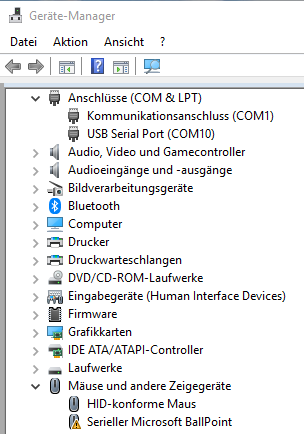
Hardware: ESP_WROVER_KIT V4.1 (integrated FTDI debug probe)
Basic setup (debug interface configuration) seems to be correct, as I am able to debug an Arduino project (e.g. arduino-wifiscan example).
However, trying to debug any espidf project (e.g. espidf-blink) gdb crashes:

TERMINAL output is:

PIO Plus (https   pioplus.com) v1.4.10
Processing esp-wrover-kit (platform: espressif32; board: esp-wrover-kit; framework: espidf)
------------------------------------------------------------------------------------------------------------------------------------------------------------------------------------------------------------------
Verbose mode can be enabled via `-v, --verbose` option
PLATFORM: Espressif 32 > Espressif ESP-WROVER-KIT
SYSTEM: ESP32 240MHz 320KB RAM (4MB Flash)
DEBUG: CURRENT(ftdi) ON-BOARD(ftdi) EXTERNAL(esp-prog, minimodule, olimex-arm-usb-ocd, olimex-arm-usb-ocd-h, olimex-arm-usb-tiny-h, olimex-jtag-tiny)
Library Dependency Finder -> http   bit.ly/configure-pio-ldf
LDF MODES: FINDER(chain) COMPATIBILITY(soft)
Collected 0 compatible libraries
Scanning dependencies...
No dependencies
Compiling .pioenvs\esp-wrover-kit\src\main.o
Linking .pioenvs\esp-wrover-kit\firmware.elf
Building .pioenvs\esp-wrover-kit\firmware.bin
Retrieving maximum program size .pioenvs\esp-wrover-kit\firmware.elf
Checking size .pioenvs\esp-wrover-kit\firmware.elf
Memory Usage -> http   bit.ly/pio-memory-usage
DATA:    [          ]   4.0% (used 12956 bytes from 327680 bytes)
PROGRAM: [=         ]  13.3% (used 139136 bytes from 1048576 bytes)

DEBUGGING-CONSOLE output is:

Reading symbols from c:/Users/Hildebrand.BE/Documents/PlatformIO/Projects/181008-155725-espidf-blink/.pioenvs/esp-wrover-kit/firmware.elf...
done.
PlatformIO Unified Debugger > http   bit.ly/pio-debug
PlatformIO: Initializing remote target...
Open On-Chip Debugger 0.10.0-dev (2018-06-04-09:51)
Licensed under GNU GPL v2
For bug reports, read
	http   openocd.org/doc/doxygen/bugs.html
none separate
adapter speed: 20000 kHz
esp32 interrupt mask on
force hard breakpoints
Info : tcl server disabled
Info : telnet server disabled
Error: libusb_open() failed with LIBUSB_ERROR_NOT_SUPPORTED
Info : ftdi: if you experience problems at higher adapter clocks, try the command "ftdi_tdo_sample_edge falling"
Info : clock speed 20000 kHz
Info : JTAG tap: esp32.cpu0 tap/device found: 0x120034e5 (mfg: 0x272 (Tensilica), part: 0x2003, ver: 0x1)
Info : JTAG tap: esp32.cpu1 tap/device found: 0x120034e5 (mfg: 0x272 (Tensilica), part: 0x2003, ver: 0x1)
Info : Target halted. PRO_CPU: PC=0x400D07AF (active)    APP_CPU: PC=0x400E0F22 
cpu0: Current bits set: BreakIn BreakOut RunStallIn
cpu1: Current bits set: BreakIn BreakOut RunStallIn
Info : accepting 'gdb' connection from pipe
Info : Use core0 of target 'esp32'
Info : Target halted. PRO_CPU: PC=0x40091D07 (active)    APP_CPU: PC=0x400E0F22 
Info : Auto-detected flash size 4096 KB
Info : Using flash size 4096 KB
xTaskCreate (pvCreatedTask=0x0, uxPriority=5, pvParameters=0x0, usStackDepth=768, pcName=0x3f400e88 "\210\016@?k_task", pvTaskCode=0x400d077c <blink_task>) at C:/Users/Hildebrand.BE/.platformio/packages/framework-espidf/components/freertos/include/freertos/task.h:438
438			return xTaskCreatePinnedToCore( pvTaskCode, pcName, usStackDepth, pvParameters, uxPriority, pvCreatedTask, tskNO_AFFINITY );
Not implemented stop reason (assuming exception): undefined
Hardware assisted breakpoint 1 at 0x400d07af: file src\main.c, line 43.
Info : JTAG tap: esp32.cpu0 tap/device found: 0x120034e5 (mfg: 0x272 (Tensilica), part: 0x2003, ver: 0x1)
Info : JTAG tap: esp32.cpu1 tap/device found: 0x120034e5 (mfg: 0x272 (Tensilica), part: 0x2003, ver: 0x1)
JTAG tap: esp32.cpu0 tap/device found: 0x120034e5 (mfg: 0x272 (Tensilica), part: 0x2003, ver: 0x1)
JTAG tap: esp32.cpu1 tap/device found: 0x120034e5 (mfg: 0x272 (Tensilica), part: 0x2003, ver: 0x1)
cpu0: Current bits set: BreakIn BreakOut RunStallIn
cpu1: Current bits set: BreakIn BreakOut RunStallIn
cpu0: Current bits set: BreakIn BreakOut RunStallIn
cpu1: Current bits set: BreakIn BreakOut RunStallIn
Info : esp32: Debug controller was reset (pwrstat=0x5F, after clear 0x0F).
Info : esp32: Core was reset (pwrstat=0x5F, after clear 0x0F).
esp32: Debug controller was reset (pwrstat=0x5F, after clear 0x0F).
esp32: Core was reset (pwrstat=0x5F, after clear 0x0F).
Info : Target halted. PRO_CPU: PC=0x5000004B (active)    APP_CPU: PC=0x00000000 
esp32: target state: halted
Info : esp32: Core was reset (pwrstat=0x1F, after clear 0x0F).
Target halted. PRO_CPU: PC=0x5000004B (active)    APP_CPU: PC=0x00000000 
esp32: target state: halted
esp32: Core was reset (pwrstat=0x1F, after clear 0x0F).
Info : Target halted. PRO_CPU: PC=0x40000400 (active)    APP_CPU: PC=0x40000400 
esp32: target state: halted
** Programming Started **
Target halted. PRO_CPU: PC=0x40000400 (active)    APP_CPU: PC=0x40000400 
esp32: target state: halted
** Programming Started **
auto erase enabled
Info : Use core0 of target 'esp32'
auto erase enabled
Use core0 of target 'esp32'
Info : Target halted. PRO_CPU: PC=0x40091D07 (active)    APP_CPU: PC=0x400076E2 
Target halted. PRO_CPU: PC=0x40091D07 (active)    APP_CPU: PC=0x400076E2 
Info : Use core0 of target 'esp32'
Use core0 of target 'esp32'
Info : Target halted. PRO_CPU: PC=0x40091D07 (active)    APP_CPU: PC=0x400076DD 
Target halted. PRO_CPU: PC=0x40091D07 (active)    APP_CPU: PC=0x400076DD 
wrote 24576 bytes from file c:/Users/Hildebrand.BE/Documents/PlatformIO/Projects/181008-155725-espidf-blink/.pioenvs/esp-wrover-kit/bootloader.bin in 1.141461s (21.026 KiB/s)
** Programming Finished **
** Verify Started **
Info : Use core0 of target 'esp32'
** Verify Started **
Use core0 of target 'esp32'
Info : Target halted. PRO_CPU: PC=0x40091D07 (active)    APP_CPU: PC=0x400076DD 
Target halted. PRO_CPU: PC=0x40091D07 (active)    APP_CPU: PC=0x400076DD 
read 20704 bytes from file c:/Users/Hildebrand.BE/Documents/PlatformIO/Projects/181008-155725-espidf-blink/.pioenvs/esp-wrover-kit/bootloader.bin and flash bank 0 at offset 0x00001000 in 0.358398s (56.414 KiB/s)
contents match
read 20704 bytes from file c:/Users/Hildebrand.BE/Documents/PlatformIO/Projects/181008-155725-espidf-blink/.pioenvs/esp-wrover-kit/bootloader.bin and flash bank 0 at offset 0x00001000 in 0.358398s (56.414 KiB/s)
** Verified OK **
contents match
** Verified OK **
Info : JTAG tap: esp32.cpu0 tap/device found: 0x120034e5 (mfg: 0x272 (Tensilica), part: 0x2003, ver: 0x1)
Info : JTAG tap: esp32.cpu1 tap/device found: 0x120034e5 (mfg: 0x272 (Tensilica), part: 0x2003, ver: 0x1)
JTAG tap: esp32.cpu0 tap/device found: 0x120034e5 (mfg: 0x272 (Tensilica), part: 0x2003, ver: 0x1)
cpu0: Current bits set: BreakIn BreakOut RunStallIn
cpu1: Current bits set: BreakIn BreakOut RunStallIn
JTAG tap: esp32.cpu1 tap/device found: 0x120034e5 (mfg: 0x272 (Tensilica), part: 0x2003, ver: 0x1)
cpu0: Current bits set: BreakIn BreakOut RunStallIn
cpu1: Current bits set: BreakIn BreakOut RunStallIn
Info : esp32: Debug controller was reset (pwrstat=0x5F, after clear 0x0F).
Info : esp32: Core was reset (pwrstat=0x5F, after clear 0x0F).
esp32: Debug controller was reset (pwrstat=0x5F, after clear 0x0F).
esp32: Core was reset (pwrstat=0x5F, after clear 0x0F).
Info : Target halted. PRO_CPU: PC=0x5000004B (active)    APP_CPU: PC=0x00000000 
esp32: target state: halted
Target halted. PRO_CPU: PC=0x5000004B (active)    APP_CPU: PC=0x00000000 
esp32: target state: halted
Info : esp32: Core was reset (pwrstat=0x1F, after clear 0x0F).
esp32: Core was reset (pwrstat=0x1F, after clear 0x0F).
Info : Target halted. PRO_CPU: PC=0x40000400 (active)    APP_CPU: PC=0x40000400 
esp32: target state: halted
** Programming Started **
Target halted. PRO_CPU: PC=0x40000400 (active)    APP_CPU: PC=0x40000400 
esp32: target state: halted
** Programming Started **
auto erase enabled
auto erase enabled
Info : Use core0 of target 'esp32'
Use core0 of target 'esp32'
Info : Target halted. PRO_CPU: PC=0x40091D07 (active)    APP_CPU: PC=0x400076E2 
Target halted. PRO_CPU: PC=0x40091D07 (active)    APP_CPU: PC=0x400076E2 
Info : Use core0 of target 'esp32'
Use core0 of target 'esp32'
Info : Target halted. PRO_CPU: PC=0x40091D07 (active)    APP_CPU: PC=0x400076DD 
Target halted. PRO_CPU: PC=0x40091D07 (active)    APP_CPU: PC=0x400076DD 
wrote 4096 bytes from file c:/Users/Hildebrand.BE/Documents/PlatformIO/Projects/181008-155725-espidf-blink/.pioenvs/esp-wrover-kit/partitions.bin in 0.637191s (6.278 KiB/s)
** Programming Finished **
** Verify Started **
Info : Use core0 of target 'esp32'
** Programming Finished **
** Verify Started **
Use core0 of target 'esp32'
Info : Target halted. PRO_CPU: PC=0x40091D07 (active)    APP_CPU: PC=0x400076E0 
Target halted. PRO_CPU: PC=0x40091D07 (active)    APP_CPU: PC=0x400076E0 
read 3072 bytes from file c:/Users/Hildebrand.BE/Documents/PlatformIO/Projects/181008-155725-espidf-blink/.pioenvs/esp-wrover-kit/partitions.bin and flash bank 0 at offset 0x00008000 in 0.265933s (11.281 KiB/s)
contents match
read 3072 bytes from file c:/Users/Hildebrand.BE/Documents/PlatformIO/Projects/181008-155725-espidf-blink/.pioenvs/esp-wrover-kit/partitions.bin and flash bank 0 at offset 0x00008000 in 0.265933s (11.281 KiB/s)
contents match
** Verified OK **
** Verified OK **
Info : JTAG tap: esp32.cpu0 tap/device found: 0x120034e5 (mfg: 0x272 (Tensilica), part: 0x2003, ver: 0x1)
Info : JTAG tap: esp32.cpu1 tap/device found: 0x120034e5 (mfg: 0x272 (Tensilica), part: 0x2003, ver: 0x1)
cpu0: Current bits set: BreakIn BreakOut RunStallIn
JTAG tap: esp32.cpu0 tap/device found: 0x120034e5 (mfg: 0x272 (Tensilica), part: 0x2003, ver: 0x1)
cpu1: Current bits set: BreakIn BreakOut RunStallIn
JTAG tap: esp32.cpu1 tap/device found: 0x120034e5 (mfg: 0x272 (Tensilica), part: 0x2003, ver: 0x1)
cpu0: Current bits set: BreakIn BreakOut RunStallIn
cpu1: Current bits set: BreakIn BreakOut RunStallIn
Info : esp32: Debug controller was reset (pwrstat=0x5F, after clear 0x0F).
Info : esp32: Core was reset (pwrstat=0x5F, after clear 0x0F).
esp32: Debug controller was reset (pwrstat=0x5F, after clear 0x0F).
esp32: Core was reset (pwrstat=0x5F, after clear 0x0F).
Info : Target halted. PRO_CPU: PC=0x5000004B (active)    APP_CPU: PC=0x00000000 
esp32: target state: halted
Info : esp32: Core was reset (pwrstat=0x1F, after clear 0x0F).
Target halted. PRO_CPU: PC=0x5000004B (active)    APP_CPU: PC=0x00000000 
esp32: target state: halted
esp32: Core was reset (pwrstat=0x1F, after clear 0x0F).
Info : Target halted. PRO_CPU: PC=0x40000400 (active)    APP_CPU: PC=0x40000400 
esp32: target state: halted
** Programming Started **
Target halted. PRO_CPU: PC=0x40000400 (active)    APP_CPU: PC=0x40000400 
esp32: target state: halted
** Programming Started **
auto erase enabled
auto erase enabled
Info : Use core0 of target 'esp32'
Use core0 of target 'esp32'
Info : Target halted. PRO_CPU: PC=0x40091D07 (active)    APP_CPU: PC=0x400076E2 
Target halted. PRO_CPU: PC=0x40091D07 (active)    APP_CPU: PC=0x400076E2 
Info : Use core0 of target 'esp32'
Use core0 of target 'esp32'
Info : Target halted. PRO_CPU: PC=0x40091D07 (active)    APP_CPU: PC=0x400076DD 
Target halted. PRO_CPU: PC=0x40091D07 (active)    APP_CPU: PC=0x400076DD 
wrote 143360 bytes from file c:/Users/Hildebrand.BE/Documents/PlatformIO/Projects/181008-155725-espidf-blink/.pioenvs/esp-wrover-kit/firmware.bin in 2.909716s (48.115 KiB/s)
** Programming Finished **
** Verify Started **
Info : Use core0 of target 'esp32'
** Programming Finished **
** Verify Started **
Use core0 of target 'esp32'
Info : Target halted. PRO_CPU: PC=0x40091D07 (active)    APP_CPU: PC=0x400076DD 
Target halted. PRO_CPU: PC=0x40091D07 (active)    APP_CPU: PC=0x400076DD 
read 139280 bytes from file c:/Users/Hildebrand.BE/Documents/PlatformIO/Projects/181008-155725-espidf-blink/.pioenvs/esp-wrover-kit/firmware.bin and flash bank 0 at offset 0x00010000 in 0.711024s (191.295 KiB/s)
contents match
read 139280 bytes from file c:/Users/Hildebrand.BE/Documents/PlatformIO/Projects/181008-155725-espidf-blink/.pioenvs/esp-wrover-kit/firmware.bin and flash bank 0 at offset 0x00010000 in 0.711024s (191.295 KiB/s)
** Verified OK **
contents match
** Verified OK **
Info : JTAG tap: esp32.cpu0 tap/device found: 0x120034e5 (mfg: 0x272 (Tensilica), part: 0x2003, ver: 0x1)
Info : JTAG tap: esp32.cpu1 tap/device found: 0x120034e5 (mfg: 0x272 (Tensilica), part: 0x2003, ver: 0x1)
cpu0: Current bits set: BreakIn BreakOut RunStallIn
cpu1: Current bits set: BreakIn BreakOut RunStallIn
JTAG tap: esp32.cpu0 tap/device found: 0x120034e5 (mfg: 0x272 (Tensilica), part: 0x2003, ver: 0x1)
JTAG tap: esp32.cpu1 tap/device found: 0x120034e5 (mfg: 0x272 (Tensilica), part: 0x2003, ver: 0x1)
cpu0: Current bits set: BreakIn BreakOut RunStallIn
cpu1: Current bits set: BreakIn BreakOut RunStallIn
Info : esp32: Debug controller was reset (pwrstat=0x5F, after clear 0x0F).
Info : esp32: Core was reset (pwrstat=0x5F, after clear 0x0F).
esp32: Debug controller was reset (pwrstat=0x5F, after clear 0x0F).
esp32: Core was reset (pwrstat=0x5F, after clear 0x0F).
Info : Target halted. PRO_CPU: PC=0x5000004B (active)    APP_CPU: PC=0x00000000 
esp32: target state: halted
Info : esp32: Core was reset (pwrstat=0x1F, after clear 0x0F).
Target halted. PRO_CPU: PC=0x5000004B (active)    APP_CPU: PC=0x00000000 
esp32: target state: halted
esp32: Core was reset (pwrstat=0x1F, after clear 0x0F).
Info : Target halted. PRO_CPU: PC=0x40000400 (active)    APP_CPU: PC=0x40000400 
esp32: target state: halted
Target halted. PRO_CPU: PC=0x40000400 (active)    APP_CPU: PC=0x40000400 
esp32: target state: halted
PlatformIO: Initialization completed
PlatformIO: Resume the execution to `debug_init_break = thb app_main`
Info : Target halted. PRO_CPU: PC=0x400D07AF (active)    APP_CPU: PC=0x400E0F22 
Target halted. PRO_CPU: PC=0x400D07AF (active)    APP_CPU: PC=0x400E0F22 
[New Thread 1073510428]
[New Thread 1073508528]
[New Thread 1073513084]
[New Thread 1073500736]
[New Thread 1073497468]
[New Thread 1073499264]
[New Thread 1073501868]
[Switching to Thread 1073506412]

Temporary breakpoint 
1, app_main () at src\main.c:43
43	    xTaskCreate(&blink_task, "blink_task", configMINIMAL_STACK_SIZE, NULL, 5, NULL);
/builds/idf/crosstool-NG/.build/src/gdb-7.10/gdb/inline-frame.c:171: internal-error: inline_frame_this_id: Assertion `!frame_id_eq (*this_id, outer_frame_id)' failed.
A problem internal to GDB has been detected,
further debugging may prove unreliable.
Quit this debugging session? 
(y or n) [answered Y; input not from terminal]

This is a bug, please report it.
  For instructions, see:
<http   www.gnu.org/software/gdb/bugs/>.


/builds/idf/crosstool-NG/.build/src/gdb-7.10/gdb/inline-frame.c:171: internal-error: inline_frame_this_id: Assertion `!frame_id_eq (*this_id, outer_frame_id)' failed.
A problem internal to GDB has been detected,
further debugging may prove unreliable.
Create a core file of GDB? 
(y or n) [answered Y; input not from terminal]

Could you reproduce this issue again with reconnecting board?

Thank you, Ivan. I disconnected the board and reconnected it. These are the results:

TERMINAL output:

Executing task in folder 181017-171508-espidf-blink: C:\Users\Hildebrand\.platformio\penv\Scripts\platformio.exe debug <

PIO Plus (https://pioplus.com) v1.4.10
Processing esp-wrover-kit (platform: espressif32; board: esp-wrover-kit; framework: espidf)
--------------------------------------------------------------------------------------------------------------------------------------------------------------------------------------
Verbose mode can be enabled via `-v, --verbose` option
PLATFORM: Espressif 32 > Espressif ESP-WROVER-KIT
SYSTEM: ESP32 240MHz 320KB RAM (4MB Flash)
DEBUG: CURRENT(ftdi) ON-BOARD(ftdi) EXTERNAL(esp-prog, minimodule, olimex-arm-usb-ocd, olimex-arm-usb-ocd-h, olimex-arm-usb-tiny-h, olimex-jtag-tiny)
Library Dependency Finder -> http://bit.ly/configure-pio-ldf
LDF MODES: FINDER(chain) COMPATIBILITY(soft)
Collected 0 compatible libraries
Scanning dependencies...
No dependencies
Retrieving maximum program size .pioenvs\esp-wrover-kit\firmware.elf
Checking size .pioenvs\esp-wrover-kit\firmware.elf
Memory Usage -> http://bit.ly/pio-memory-usage
DATA:    [          ]   4.0% (used 12948 bytes from 327680 bytes)
PROGRAM: [=         ]  13.3% (used 139052 bytes from 1048576 bytes)
============================================================================ [SUCCESS] Took 15.54 seconds ============================================================================

DEBUG CONSOLE output:

Preparing firmware for debugging...
Processing esp-wrover-kit (platform: espressif32; board: esp-wrover-kit; framework: espidf)

Verbose mode can be enabled via `-v, --verbose` option
PLATFORM: Espressif 32 > Espressif ESP-WROVER-KIT
SYSTEM: ESP32 240MHz 320KB RAM (4MB Flash)
DEBUG: CURRENT(ftdi) ON-BOARD(ftdi) EXTERNAL(esp-prog, minimodule, olimex-arm-usb-ocd, olimex-arm-usb-ocd-h, olimex-arm-usb-tiny-h, olimex-jtag-tiny)
Library Dependency Finder -> http://bit.ly/configure-pio-ldf
LDF MODES: FINDER(chain) COMPATIBILITY(soft)
Collected 0 compatible libraries
Scanning dependencies...
No dependencies
Retrieving maximum program size .pioenvsesp-wrover-kitirmware.elf
Checking size .pioenvsesp-wrover-kitirmware.elf
Memory Usage -> http://bit.ly/pio-memory-usage
DATA:    [          ]   4.0% (used 12948 bytes from 327680 bytes)
PROGRAM: [=         ]  13.3% (used 139052 bytes from 1048576 bytes)
[SUCCESS] Took 15.11 seconds
Reading symbols from c:/Users/Hildebrand/Documents/PlatformIO/Projects/181017-171508-espidf-blink/.pioenvs/esp-wrover-kit/firmware.elf...
done.
PlatformIO Unified Debugger > http://bit.ly/pio-debug
PlatformIO: Initializing remote target...
Open On-Chip Debugger 0.10.0-dev (2018-06-04-09:51)
Licensed under GNU GPL v2
For bug reports, read
	http://openocd.org/doc/doxygen/bugs.html
none separate
adapter speed: 20000 kHz
esp32 interrupt mask on
force hard breakpoints
Info : tcl server disabled
Info : telnet server disabled
Error: libusb_open() failed with LIBUSB_ERROR_NOT_SUPPORTED
Info : ftdi: if you experience problems at higher adapter clocks, try the command "ftdi_tdo_sample_edge falling"
Info : clock speed 20000 kHz
Info : JTAG tap: esp32.cpu0 tap/device found: 0x120034e5 (mfg: 0x272 (Tensilica), part: 0x2003, ver: 0x1)
Info : JTAG tap: esp32.cpu1 tap/device found: 0x120034e5 (mfg: 0x272 (Tensilica), part: 0x2003, ver: 0x1)
Info : esp32: Debug controller was reset (pwrstat=0x5F, after clear 0x0F).
Info : esp32: Core was reset (pwrstat=0x5F, after clear 0x0F).
cpu0: Current bits set: BreakIn BreakOut RunStallIn
cpu1: Current bits set: BreakIn BreakOut RunStallIn
Info : accepting 'gdb' connection from pipe
Info : Target halted. PRO_CPU: PC=0x400E0F22 (active)    APP_CPU: PC=0x400E0F22 
esp32: target state: halted
Info : Use core0 of target 'esp32'
Info : Target halted. PRO_CPU: PC=0x40091D07 (active)    APP_CPU: PC=0x400E0F22 
Info : Auto-detected flash size 4096 KB
Info : Using flash size 4096 KB
0x400e0f22 in esp_vApplicationWaitiHook () at C:\Users\Hildebrand\.platformio\packages\framework-espidf\components\esp32\freertos_hooks.c:66
66	    asm("waiti 0");
Not implemented stop reason (assuming exception): undefined
Hardware assisted breakpoint 1 at 0x400d07af: file src\main.c, line 43.
Info : JTAG tap: esp32.cpu0 tap/device found: 0x120034e5 (mfg: 0x272 (Tensilica), part: 0x2003, ver: 0x1)
Info : JTAG tap: esp32.cpu1 tap/device found: 0x120034e5 (mfg: 0x272 (Tensilica), part: 0x2003, ver: 0x1)
JTAG tap: esp32.cpu0 tap/device found: 0x120034e5 (mfg: 0x272 (Tensilica), part: 0x2003, ver: 0x1)
JTAG tap: esp32.cpu1 tap/device found: 0x120034e5 (mfg: 0x272 (Tensilica), part: 0x2003, ver: 0x1)
cpu0: Current bits set: BreakIn BreakOut RunStallIn
cpu1: Current bits set: BreakIn BreakOut RunStallIn
cpu0: Current bits set: BreakIn BreakOut RunStallIn
cpu1: Current bits set: BreakIn BreakOut RunStallIn
Info : esp32: Debug controller was reset (pwrstat=0x5F, after clear 0x0F).
Info : esp32: Core was reset (pwrstat=0x5F, after clear 0x0F).
esp32: Debug controller was reset (pwrstat=0x5F, after clear 0x0F).
esp32: Core was reset (pwrstat=0x5F, after clear 0x0F).
Info : Target halted. PRO_CPU: PC=0x5000004B (active)    APP_CPU: PC=0x00000000 
esp32: target state: halted
Target halted. PRO_CPU: PC=0x5000004B (active)    APP_CPU: PC=0x00000000 
esp32: target state: halted
Info : esp32: Core was reset (pwrstat=0x1F, after clear 0x0F).
esp32: Core was reset (pwrstat=0x1F, after clear 0x0F).
Info : Target halted. PRO_CPU: PC=0x40000400 (active)    APP_CPU: PC=0x40000400 
esp32: target state: halted
** Programming Started **
Target halted. PRO_CPU: PC=0x40000400 (active)    APP_CPU: PC=0x40000400 
esp32: target state: halted
** Programming Started **
auto erase enabled
Info : Use core0 of target 'esp32'
auto erase enabled
Use core0 of target 'esp32'
Info : Target halted. PRO_CPU: PC=0x40091D07 (active)    APP_CPU: PC=0x400076E0 
Target halted. PRO_CPU: PC=0x40091D07 (active)    APP_CPU: PC=0x400076E0 
Info : Use core0 of target 'esp32'
Use core0 of target 'esp32'
Info : Target halted. PRO_CPU: PC=0x40091D07 (active)    APP_CPU: PC=0x400076DD 
Target halted. PRO_CPU: PC=0x40091D07 (active)    APP_CPU: PC=0x400076DD 
wrote 24576 bytes from file c:/Users/Hildebrand/Documents/PlatformIO/Projects/181017-171508-espidf-blink/.pioenvs/esp-wrover-kit/bootloader.bin in 1.200182s (19.997 KiB/s)
** Programming Finished **
** Verify Started **
Info : Use core0 of target 'esp32'
** Programming Finished **
** Verify Started **
Use core0 of target 'esp32'
Info : Target halted. PRO_CPU: PC=0x40091D07 (active)    APP_CPU: PC=0x400076DD 
Target halted. PRO_CPU: PC=0x40091D07 (active)    APP_CPU: PC=0x400076DD 
read 20688 bytes from file c:/Users/Hildebrand/Documents/PlatformIO/Projects/181017-171508-espidf-blink/.pioenvs/esp-wrover-kit/bootloader.bin and flash bank 0 at offset 0x00001000 in 0.360084s (56.107 KiB/s)
contents match
** Verified OK **
read 20688 bytes from file c:/Users/Hildebrand/Documents/PlatformIO/Projects/181017-171508-espidf-blink/.pioenvs/esp-wrover-kit/bootloader.bin and flash bank 0 at offset 0x00001000 in 0.360084s (56.107 KiB/s)
contents match
** Verified OK **
Info : JTAG tap: esp32.cpu0 tap/device found: 0x120034e5 (mfg: 0x272 (Tensilica), part: 0x2003, ver: 0x1)
Info : JTAG tap: esp32.cpu1 tap/device found: 0x120034e5 (mfg: 0x272 (Tensilica), part: 0x2003, ver: 0x1)
JTAG tap: esp32.cpu0 tap/device found: 0x120034e5 (mfg: 0x272 (Tensilica), part: 0x2003, ver: 0x1)
JTAG tap: esp32.cpu1 tap/device found: 0x120034e5 (mfg: 0x272 (Tensilica), part: 0x2003, ver: 0x1)
cpu0: Current bits set: BreakIn BreakOut RunStallIn
cpu1: Current bits set: BreakIn BreakOut RunStallIn
cpu0: Current bits set: BreakIn BreakOut RunStallIn
cpu1: Current bits set: BreakIn BreakOut RunStallIn
Info : esp32: Debug controller was reset (pwrstat=0x5F, after clear 0x0F).
Info : esp32: Core was reset (pwrstat=0x5F, after clear 0x0F).
esp32: Debug controller was reset (pwrstat=0x5F, after clear 0x0F).
esp32: Core was reset (pwrstat=0x5F, after clear 0x0F).
Info : Target halted. PRO_CPU: PC=0x5000004B (active)    APP_CPU: PC=0x00000000 
esp32: target state: halted
Target halted. PRO_CPU: PC=0x5000004B (active)    APP_CPU: PC=0x00000000 
esp32: target state: halted
Info : esp32: Core was reset (pwrstat=0x1F, after clear 0x0F).
esp32: Core was reset (pwrstat=0x1F, after clear 0x0F).
Info : Target halted. PRO_CPU: PC=0x40000400 (active)    APP_CPU: PC=0x40000400 
Target halted. PRO_CPU: PC=0x40000400 (active)    APP_CPU: PC=0x40000400 
esp32: target state: halted
** Programming Started **
auto erase enabled
Info : Use core0 of target 'esp32'
esp32: target state: halted
** Programming Started **
auto erase enabled
Use core0 of target 'esp32'
Info : Target halted. PRO_CPU: PC=0x40091D07 (active)    APP_CPU: PC=0x400076E2 
Target halted. PRO_CPU: PC=0x40091D07 (active)    APP_CPU: PC=0x400076E2 
Info : Use core0 of target 'esp32'
Use core0 of target 'esp32'
Info : Target halted. PRO_CPU: PC=0x40091D07 (active)    APP_CPU: PC=0x400076E0 
Target halted. PRO_CPU: PC=0x40091D07 (active)    APP_CPU: PC=0x400076E0 
wrote 4096 bytes from file c:/Users/Hildebrand/Documents/PlatformIO/Projects/181017-171508-espidf-blink/.pioenvs/esp-wrover-kit/partitions.bin in 0.671349s (5.958 KiB/s)
** Programming Finished **
** Verify Started **
Info : Use core0 of target 'esp32'
** Programming Finished **
** Verify Started **
Use core0 of target 'esp32'
Info : Target halted. PRO_CPU: PC=0x40091D07 (active)    APP_CPU: PC=0x400076DD 
Target halted. PRO_CPU: PC=0x40091D07 (active)    APP_CPU: PC=0x400076DD 
read 3072 bytes from file c:/Users/Hildebrand/Documents/PlatformIO/Projects/181017-171508-espidf-blink/.pioenvs/esp-wrover-kit/partitions.bin and flash bank 0 at offset 0x00008000 in 0.286366s (10.476 KiB/s)
contents match
** Verified OK **
read 3072 bytes from file c:/Users/Hildebrand/Documents/PlatformIO/Projects/181017-171508-espidf-blink/.pioenvs/esp-wrover-kit/partitions.bin and flash bank 0 at offset 0x00008000 in 0.286366s (10.476 KiB/s)
contents match
** Verified OK **
Info : JTAG tap: esp32.cpu0 tap/device found: 0x120034e5 (mfg: 0x272 (Tensilica), part: 0x2003, ver: 0x1)
Info : JTAG tap: esp32.cpu1 tap/device found: 0x120034e5 (mfg: 0x272 (Tensilica), part: 0x2003, ver: 0x1)
JTAG tap: esp32.cpu0 tap/device found: 0x120034e5 (mfg: 0x272 (Tensilica), part: 0x2003, ver: 0x1)
JTAG tap: esp32.cpu1 tap/device found: 0x120034e5 (mfg: 0x272 (Tensilica), part: 0x2003, ver: 0x1)
cpu0: Current bits set: BreakIn BreakOut RunStallIn
cpu1: Current bits set: BreakIn BreakOut RunStallIn
cpu0: Current bits set: BreakIn BreakOut RunStallIn
cpu1: Current bits set: BreakIn BreakOut RunStallIn
Info : esp32: Debug controller was reset (pwrstat=0x5F, after clear 0x0F).
Info : esp32: Core was reset (pwrstat=0x5F, after clear 0x0F).
esp32: Debug controller was reset (pwrstat=0x5F, after clear 0x0F).
esp32: Core was reset (pwrstat=0x5F, after clear 0x0F).
Info : Target halted. PRO_CPU: PC=0x5000004B (active)    APP_CPU: PC=0x00000000 
esp32: target state: halted
Target halted. PRO_CPU: PC=0x5000004B (active)    APP_CPU: PC=0x00000000 
esp32: target state: halted
Info : esp32: Core was reset (pwrstat=0x1F, after clear 0x0F).
esp32: Core was reset (pwrstat=0x1F, after clear 0x0F).
Info : Target halted. PRO_CPU: PC=0x40000400 (active)    APP_CPU: PC=0x40000400 
Target halted. PRO_CPU: PC=0x40000400 (active)    APP_CPU: PC=0x40000400 
esp32: target state: halted
** Programming Started **
auto erase enabled
Info : Use core0 of target 'esp32'
esp32: target state: halted
** Programming Started **
auto erase enabled
Use core0 of target 'esp32'
Info : Target halted. PRO_CPU: PC=0x40091D07 (active)    APP_CPU: PC=0x400076DD 
Target halted. PRO_CPU: PC=0x40091D07 (active)    APP_CPU: PC=0x400076DD 
Info : Use core0 of target 'esp32'
Use core0 of target 'esp32'
Info : Target halted. PRO_CPU: PC=0x40091D07 (active)    APP_CPU: PC=0x400076DD 
Target halted. PRO_CPU: PC=0x40091D07 (active)    APP_CPU: PC=0x400076DD 
wrote 139264 bytes from file c:/Users/Hildebrand/Documents/PlatformIO/Projects/181017-171508-espidf-blink/.pioenvs/esp-wrover-kit/firmware.bin in 2.866774s (47.440 KiB/s)
** Programming Finished **
wrote 139264 bytes from file c:/Users/Hildebrand/Documents/PlatformIO/Projects/181017-171508-espidf-blink/.pioenvs/esp-wrover-kit/firmware.bin in 2.866774s (47.440 KiB/s)
** Programming Finished **
** Verify Started **
Info : Use core0 of target 'esp32'
** Verify Started **
Use core0 of target 'esp32'
Info : Target halted. PRO_CPU: PC=0x40091D07 (active)    APP_CPU: PC=0x400076DD 
Target halted. PRO_CPU: PC=0x40091D07 (active)    APP_CPU: PC=0x400076DD 
read 139184 bytes from file c:/Users/Hildebrand/Documents/PlatformIO/Projects/181017-171508-espidf-blink/.pioenvs/esp-wrover-kit/firmware.bin and flash bank 0 at offset 0x00010000 in 0.748662s (181.553 KiB/s)
contents match
** Verified OK **
read 139184 bytes from file c:/Users/Hildebrand/Documents/PlatformIO/Projects/181017-171508-espidf-blink/.pioenvs/esp-wrover-kit/firmware.bin and flash bank 0 at offset 0x00010000 in 0.748662s (181.553 KiB/s)
contents match
** Verified OK **
Info : JTAG tap: esp32.cpu0 tap/device found: 0x120034e5 (mfg: 0x272 (Tensilica), part: 0x2003, ver: 0x1)
Info : JTAG tap: esp32.cpu1 tap/device found: 0x120034e5 (mfg: 0x272 (Tensilica), part: 0x2003, ver: 0x1)
cpu0: Current bits set: BreakIn BreakOut RunStallIn
cpu1: Current bits set: BreakIn BreakOut RunStallIn
JTAG tap: esp32.cpu0 tap/device found: 0x120034e5 (mfg: 0x272 (Tensilica), part: 0x2003, ver: 0x1)
JTAG tap: esp32.cpu1 tap/device found: 0x120034e5 (mfg: 0x272 (Tensilica), part: 0x2003, ver: 0x1)
cpu0: Current bits set: BreakIn BreakOut RunStallIn
cpu1: Current bits set: BreakIn BreakOut RunStallIn
Info : esp32: Debug controller was reset (pwrstat=0x5F, after clear 0x0F).
Info : esp32: Core was reset (pwrstat=0x5F, after clear 0x0F).
esp32: Debug controller was reset (pwrstat=0x5F, after clear 0x0F).
esp32: Core was reset (pwrstat=0x5F, after clear 0x0F).
Info : Target halted. PRO_CPU: PC=0x5000004B (active)    APP_CPU: PC=0x00000000 
esp32: target state: halted
Target halted. PRO_CPU: PC=0x5000004B (active)    APP_CPU: PC=0x00000000 
esp32: target state: halted
Info : esp32: Core was reset (pwrstat=0x1F, after clear 0x0F).
esp32: Core was reset (pwrstat=0x1F, after clear 0x0F).
Info : Target halted. PRO_CPU: PC=0x40000400 (active)    APP_CPU: PC=0x40000400 
esp32: target state: halted
Target halted. PRO_CPU: PC=0x40000400 (active)    APP_CPU: PC=0x40000400 
esp32: target state: halted
PlatformIO: Initialization completed
PlatformIO: Resume the execution to `debug_init_break = thb app_main`
Info : Target halted. PRO_CPU: PC=0x400D07AF (active)    APP_CPU: PC=0x400E0F22 
Target halted. PRO_CPU: PC=0x400D07AF (active)    APP_CPU: PC=0x400E0F22 
[New Thread 1073510420]
[New Thread 1073508520]
[New Thread 1073513076]
[New Thread 1073500728]
[New Thread 1073497460]
[New Thread 1073499256]
[New Thread 1073501860]
[Switching to Thread 1073506404]

Temporary breakpoint 
1, app_main () at src\main.c:43
43	    xTaskCreate(&blink_task, "blink_task", configMINIMAL_STACK_SIZE, NULL, 5, NULL);
/builds/idf/crosstool-NG/.build/src/gdb-7.10/gdb/inline-frame.c:171: internal-error: inline_frame_this_id: Assertion `!frame_id_eq (*this_id, outer_frame_id)' failed.
A problem internal to GDB has been detected,
further debugging may prove unreliable.
Quit this debugging session? 
(y or n) [answered Y; input not from terminal]

This is a bug, please report it.
  For instructions, see:
<http://www.gnu.org/software/gdb/bugs/>.


/builds/idf/crosstool-NG/.build/src/gdb-7.10/gdb/inline-frame.c:171: internal-error: inline_frame_this_id: Assertion `!frame_id_eq (*this_id, outer_frame_id)' failed.
A problem internal to GDB has been detected,
further debugging may prove unreliable.
Create a core file of GDB? 
(y or n) [answered Y; input not from terminal]

I noticed something, Ivan - don’t know if it is of importance, it just seems weird:
I noticed a “Serial Microsoft Ball BallPoint” device in Device-Manager besides my regular mouse. I don’t have a BallPoint Device tho. When I unplugged the ESP-WROVER-KIT this BallPoint device disappears from Device-Manager.
This only happens after starting a esp-idf debug session (which fails), but not with an arduino debug session (which works).

So this might be related to the problem I am facing…
(but: The BallPoint device also appears on a non-debug-build and run of the esp-idf blink example - so maybe simply an effect of how the blink example responds on the virtual com port?)
(My Windows Version is Windows 10 Version 1803)

ballpoint

We experience the same issue and already reported to ESP team. We will back here soon with updates.

1 Like

We did a quick fix on our side. Could you open PlatformIO IDE Terminal and type

pio update
pio upgrade --dev

Does debugging work now?

1 Like

Thank you Ivan, I have tried on two PC’s, both Win10.
I was able to start the debugger on the secondary (not my own) PC after I did the update, upgrade and installed the latest openOCD files. However, I had to completely remove the FTDI drivers and reinstall them to make it work.
Now, on my own PC I did the same thing, including reinstalling the FTDI drivers, but I still get an error (which is different from the error I had on the other PC before reinstalling the FTDI drivers):
[This seems to be a new problem, as it appears with esp-idf as well as with arduino projects.]

Preparing firmware for debugging...
Processing esp wrover kit (platform: espressif32; board: esp-wrover-kit; framework: arduino)

Verbose mode can be enabled via `-v, --verbose` option
PLATFORM: Espressif 32 > Espressif ESP-WROVER-KIT
SYSTEM: ESP32 240MHz 320KB RAM (4MB Flash)
DEBUG: CURRENT(ftdi) ON-BOARD(ftdi) EXTERNAL(esp-prog, minimodule, olimex-arm-usb-ocd, olimex-arm-usb-ocd-h, olimex-arm-usb-tiny-h, olimex-jtag-tiny)
Library Dependency Finder -> http://bit.ly/configure-pio-ldf
LDF MODES: FINDER(chain) COMPATIBILITY(soft)
Collected 24 compatible libraries
Scanning dependencies...
No dependencies
Retrieving maximum program size .pioenvsesp wrover kitirmware.elf
Checking size .pioenvsesp wrover kitirmware.elf
Memory Usage -> http://bit.ly/pio-memory-usage
DATA:    [          ]   4.3% (used 13948 bytes from 327680 bytes)
PROGRAM: [==        ]  16.4% (used 215528 bytes from 1310720 bytes)
[SUCCESS] Took 2.17 seconds

[SUMMARY]
Environment esp wrover kit     	[SUCCESS]
Environment esp32doit-devkit-v1	[SKIP]
Environment lolin32            	[SKIP]
[SUCCESS] Took 2.17 seconds
Reading symbols from c:/Users/Hildebrand/Documents/PlatformIO/Projects/181022-194025-arduino-blink/.pioenvs/esp wrover kit/firmware.elf...
done.
PlatformIO Unified Debugger > http://bit.ly/pio-debug
PlatformIO: Initializing remote target...
Open On-Chip Debugger 0.10.0-dev (2018-09-20-12:54)
Licensed under GNU GPL v2
For bug reports, read
	http://openocd.org/doc/doxygen/bugs.html
none separate
adapter speed: 20000 kHz
esp32 interrupt mask on
Info : tcl server disabled
Info : telnet server disabled
Error: libusb_open() failed with LIBUSB_ERROR_NOT_SUPPORTED
Info : ftdi: if you experience problems at higher adapter clocks, try the command "ftdi_tdo_sample_edge falling"
Info : clock speed 20000 kHz
Error: JTAG scan chain interrogation failed: all ones
Error: Check JTAG interface, timings, target power, etc.
Error: Trying to use configured scan chain anyway...
Error: esp32.cpu0: IR capture error; saw 0x1f not 0x01
Warn : Bypassing JTAG setup events due to errors
Info : esp32: Debug controller was reset (pwrstat=0xFF, after clear 0xFF).
Info : esp32: Core was reset (pwrstat=0xFF, after clear 0xFF).
Error: cpu0: esp32_fetch_all_regs (line 225): DSR (FFFFFFFF) indicates target still busy!
Error: cpu0: esp32_fetch_all_regs (line 225): DSR (FFFFFFFF) indicates DIR instruction generated an exception!
Error: cpu0: esp32_fetch_all_regs (line 225): DSR (FFFFFFFF) indicates DIR instruction generated an overrun!
Error: cpu0: esp32_fetch_all_regs (line 255): DSR (FFFFFFFF) indicates target still busy!
Error: cpu0: esp32_fetch_all_regs (line 255): DSR (FFFFFFFF) indicates DIR instruction generated an exception!
Error: cpu0: esp32_fetch_all_regs (line 255): DSR (FFFFFFFF) indicates DIR instruction generated an overrun!
Error: Exception reading pc!

Info : Target halted. PRO_CPU: PC=0x00000000 (active)    APP_CPU: PC=0x00000000 
Error: cpu0: xtensa_write_memory (line 759): DSR (FFFFFFFF) indicates target still busy!
Error: cpu0: xtensa_write_memory (line 759): DSR (FFFFFFFF) indicates DIR instruction generated an exception!
Error: cpu0: xtensa_write_memory (line 759): DSR (FFFFFFFF) indicates DIR instruction generated an overrun!
Warn : esp32: Failed writing 4 bytes at address 0x3FF5F064, data - a1, 3a, d8, 50, a1, 3a, d8, 50
embedded:startup.tcl:21: Error: 
in procedure 'init' 
in procedure 'ocd_bouncer' 
in procedure 'esp_smp_break_config' 
in procedure 'esp32' called at file "C:/Users/Hildebrand/.platformio/packages/tool-openocd-esp32/share/openocd/scripts/target/esp32.cfg", line 54
in procedure 'ocd_bouncer' 
in procedure 'esp_core_halt' 
in procedure 'esp32' called at file "C:/Users/Hildebrand/.platformio/packages/tool-openocd-esp32/share/openocd/scripts/target/esp32.cfg", line 44
in procedure 'ocd_bouncer' 
at file "embedded:startup.tcl", line 21

Error: cpu0: xtensa_read_memory (line 652): DSR (FFFFFFFF) indicates target still busy!
Error: cpu0: xtensa_read_memory (line 652): DSR (FFFFFFFF) indicates DIR instruction generated an exception!
Error: cpu0: xtensa_read_memory (line 652): DSR (FFFFFFFF) indicates DIR instruction generated an overrun!
Warn : cpu0: Failed reading 4 bytes at address 0x3FF00030
Error: Failed to read target memory (-4)!
cpu0: Current bits set: BreakIn BreakOut RunStallIn DebugModeOut
cpu1: Current bits set: BreakIn BreakOut RunStallIn DebugModeOut
Info : accepting 'gdb' connection from pipe
Error: cpu0: xtensa_read_memory (line 652): DSR (FFFFFFFF) indicates target still busy!
Error: cpu0: xtensa_read_memory (line 652): DSR (FFFFFFFF) indicates DIR instruction generated an exception!
Error: cpu0: xtensa_read_memory (line 652): DSR (FFFFFFFF) indicates DIR instruction generated an overrun!
Warn : cpu0: Failed reading 5960 bytes at address 0x40090000
Error: no working area available, can't alloc space for stub code!
Error: Failed to load stub (-308)!
Error: Algorithm run faied (-308)!
Error: Faied to run flasher stub (-308)!
Warn : Failed to get flash mappings (-308)!
Error: cpu0: xtensa_read_memory (line 652): DSR (FFFFFFFF) indicates target still busy!
Error: cpu0: xtensa_read_memory (line 652): DSR (FFFFFFFF) indicates DIR instruction generated an exception!
Error: cpu0: xtensa_read_memory (line 652): DSR (FFFFFFFF) indicates DIR instruction generated an overrun!
Warn : cpu0: Failed reading 5960 bytes at address 0x40090000
Error: no working area available, can't alloc space for stub code!
Error: Failed to load stub (-308)!
Error: Algorithm run faied (-308)!
Error: Faied to run flasher stub (-308)!
Error: Failed to probe flash, size 0 KB
Error: auto_probe failed
Error: Connect failed. Consider setting up a gdb-attach event for the target to prepare target for GDB connect, or use 'gdb_memory_map disable'.
Error: attempted 'gdb' connection rejected
Error: error during select: Unknown error
Info : Restore debug stubs @ 0 on core0 of target 'esp32'
.pioinit:10: Error in sourced command file:
Remote communication error.  Target disconnected.: No error.

Look’s like you are using the wrong FTDI2232 channel or some configuration is wrong.
Make sure you use zadig tool to set the FTDI2232 channel 0 to winusb driver

I also see this error occasionally, it’s because my debug probe cannot halt the mcu correctly for some reason, then I just reconnect the board and debug probe (a few times if needed) and it works again.

Thank you Valerii. Unfortunately reconnecting the board does not help. I tried several times.

You also can try to completely erase the board’s flash memory and program your board again. To erase the memory, go to the next folder: C:\Users\Hildebrand\.platformio\packages\tool-esptoolpy and run the next command:

python esptool.py erase_flash

I double checked. channel 0 is used as WinUSB, channel 1 as COM Port

Thank you. Did that, and the flash was erased.
(Had to change it to python .\esptool.py erase_flash)
However, the problem still exists.
I get a message box saying:
Failed to launch GDB: .pioinit:10: Error in sourced command file:
Remote communication error. Target disconnected.: No error. (from interpreter-exec console “source .pioinit”)

That’s weird. Could you please upload somewhere two log outputs from Debug console tab for both an Arduino (that can be debugged) and esp-idf projects?

I think there is a misunderstanding: Ever since I made the changes (update, upgrade --dev and latest openOCD), neuther arduino, nor esp-idf projects can be debugged:

arduino-blink:

Preparing firmware for debugging...
Processing esp wrover kit (platform: espressif32; board: esp-wrover-kit; framework: arduino)

Verbose mode can be enabled via `-v, --verbose` option
PLATFORM: Espressif 32 > Espressif ESP-WROVER-KIT
SYSTEM: ESP32 240MHz 320KB RAM (4MB Flash)
DEBUG: CURRENT(ftdi) ON-BOARD(ftdi) EXTERNAL(esp-prog, minimodule, olimex-arm-usb-ocd, olimex-arm-usb-ocd-h, olimex-arm-usb-tiny-h, olimex-jtag-tiny)
Library Dependency Finder -> http://bit.ly/configure-pio-ldf
LDF MODES: FINDER(chain) COMPATIBILITY(soft)
Collected 24 compatible libraries
Scanning dependencies...
No dependencies
Retrieving maximum program size .pioenvsesp wrover kitirmware.elf
Checking size .pioenvsesp wrover kitirmware.elf
Memory Usage -> http://bit.ly/pio-memory-usage
DATA:    [          ]   4.3% (used 13948 bytes from 327680 bytes)
PROGRAM: [==        ]  16.4% (used 215528 bytes from 1310720 bytes)
[SUCCESS] Took 2.20 seconds
Reading symbols from c:/Users/Hildebrand/Documents/PlatformIO/Projects/181022-194025-arduino-blink/.pioenvs/esp wrover kit/firmware.elf...
done.
PlatformIO Unified Debugger > http://bit.ly/pio-debug
PlatformIO: Initializing remote target...
Open On-Chip Debugger 0.10.0-dev (2018-09-20-12:54)
Licensed under GNU GPL v2
For bug reports, read
	http://openocd.org/doc/doxygen/bugs.html
none separate
adapter speed: 20000 kHz
esp32 interrupt mask on
Info : tcl server disabled
Info : telnet server disabled
Error: libusb_open() failed with LIBUSB_ERROR_NOT_SUPPORTED
Info : ftdi: if you experience problems at higher adapter clocks, try the command "ftdi_tdo_sample_edge falling"
Info : clock speed 20000 kHz
Error: JTAG scan chain interrogation failed: all ones
Error: Check JTAG interface, timings, target power, etc.
Error: Trying to use configured scan chain anyway...
Error: esp32.cpu0: IR capture error; saw 0x1f not 0x01
Warn : Bypassing JTAG setup events due to errors
Info : esp32: Debug controller was reset (pwrstat=0xFF, after clear 0xFF).
Info : esp32: Core was reset (pwrstat=0xFF, after clear 0xFF).
Error: cpu0: esp32_fetch_all_regs (line 225): DSR (FFFFFFFF) indicates target still busy!
Error: cpu0: esp32_fetch_all_regs (line 225): DSR (FFFFFFFF) indicates DIR instruction generated an exception!
Error: cpu0: esp32_fetch_all_regs (line 225): DSR (FFFFFFFF) indicates DIR instruction generated an overrun!
Error: cpu0: esp32_fetch_all_regs (line 255): DSR (FFFFFFFF) indicates target still busy!
Error: cpu0: esp32_fetch_all_regs (line 255): DSR (FFFFFFFF) indicates DIR instruction generated an exception!
Error: cpu0: esp32_fetch_all_regs (line 255): DSR (FFFFFFFF) indicates DIR instruction generated an overrun!
Error: Exception reading pc!

Info : Target halted. PRO_CPU: PC=0x00000000 (active)    APP_CPU: PC=0x00000000 
Error: cpu0: xtensa_write_memory (line 759): DSR (FFFFFFFF) indicates target still busy!
Error: cpu0: xtensa_write_memory (line 759): DSR (FFFFFFFF) indicates DIR instruction generated an exception!
Error: cpu0: xtensa_write_memory (line 759): DSR (FFFFFFFF) indicates DIR instruction generated an overrun!
Warn : esp32: Failed writing 4 bytes at address 0x3FF5F064, data - a1, 3a, d8, 50, a1, 3a, d8, 50
embedded:startup.tcl:21: Error: 
in procedure 'init' 
in procedure 'ocd_bouncer' 
in procedure 'esp_smp_break_config' 
in procedure 'esp32' called at file "C:/Users/Hildebrand/.platformio/packages/tool-openocd-esp32/share/openocd/scripts/target/esp32.cfg", line 54
in procedure 'ocd_bouncer' 
in procedure 'esp_core_halt' 
in procedure 'esp32' called at file "C:/Users/Hildebrand/.platformio/packages/tool-openocd-esp32/share/openocd/scripts/target/esp32.cfg", line 44
in procedure 'ocd_bouncer' 
at file "embedded:startup.tcl", line 21

Error: cpu0: xtensa_read_memory (line 652): DSR (FFFFFFFF) indicates target still busy!
Error: cpu0: xtensa_read_memory (line 652): DSR (FFFFFFFF) indicates DIR instruction generated an exception!
Error: cpu0: xtensa_read_memory (line 652): DSR (FFFFFFFF) indicates DIR instruction generated an overrun!
Warn : cpu0: Failed reading 4 bytes at address 0x3FF00030
Error: Failed to read target memory (-4)!
cpu0: Current bits set: BreakIn BreakOut RunStallIn DebugModeOut
cpu1: Current bits set: BreakIn BreakOut RunStallIn DebugModeOut
Info : accepting 'gdb' connection from pipe
Error: cpu0: xtensa_read_memory (line 652): DSR (FFFFFFFF) indicates target still busy!
Error: cpu0: xtensa_read_memory (line 652): DSR (FFFFFFFF) indicates DIR instruction generated an exception!
Error: cpu0: xtensa_read_memory (line 652): DSR (FFFFFFFF) indicates DIR instruction generated an overrun!
Warn : cpu0: Failed reading 5960 bytes at address 0x40090000
Error: no working area available, can't alloc space for stub code!
Error: Failed to load stub (-308)!
Error: Algorithm run faied (-308)!
Error: Faied to run flasher stub (-308)!
Warn : Failed to get flash mappings (-308)!
Error: cpu0: xtensa_read_memory (line 652): DSR (FFFFFFFF) indicates target still busy!
Error: cpu0: xtensa_read_memory (line 652): DSR (FFFFFFFF) indicates DIR instruction generated an exception!
Error: cpu0: xtensa_read_memory (line 652): DSR (FFFFFFFF) indicates DIR instruction generated an overrun!
Warn : cpu0: Failed reading 5960 bytes at address 0x40090000
Error: no working area available, can't alloc space for stub code!
Error: Failed to load stub (-308)!
Error: Algorithm run faied (-308)!
Error: Faied to run flasher stub (-308)!
Error: Failed to probe flash, size 0 KB
Error: auto_probe failed
Error: Connect failed. Consider setting up a gdb-attach event for the target to prepare target for GDB connect, or use 'gdb_memory_map disable'.
Error: attempted 'gdb' connection rejected
Error: error during select: Unknown error
Info : Restore debug stubs @ 0 on core0 of target 'esp32'
.pioinit:10: Error in sourced command file:
Remote communication error.  Target disconnected.: No error.

espidf-hello-world:

Preparing firmware for debugging...
Processing esp32dev (platform: espressif32; board: esp32dev; framework: espidf)

Verbose mode can be enabled via `-v, --verbose` option
PLATFORM: Espressif 32 > Espressif ESP32 Dev Module
SYSTEM: ESP32 240MHz 320KB RAM (4MB Flash)
DEBUG: CURRENT(esp-prog) EXTERNAL(esp-prog, minimodule, olimex-arm-usb-ocd, olimex-arm-usb-ocd-h, olimex-arm-usb-tiny-h, olimex-jtag-tiny)
Library Dependency Finder -> http://bit.ly/configure-pio-ldf
LDF MODES: FINDER(chain) COMPATIBILITY(soft)
Collected 0 compatible libraries
Scanning dependencies...
No dependencies
Retrieving maximum program size .pioenvsesp32devirmware.elf
Checking size .pioenvsesp32devirmware.elf
Memory Usage -> http://bit.ly/pio-memory-usage
DATA:    [          ]   4.0% (used 13128 bytes from 327680 bytes)
PROGRAM: [=         ]  13.0% (used 136744 bytes from 1048576 bytes)
[SUCCESS] Took 21.02 seconds

[SUMMARY]
Environment esp32dev      	[SUCCESS]
Environment esp wrover kit	[SKIP]
Environment lolin 32      	[SKIP]
[SUCCESS] Took 21.02 seconds
Reading symbols from c:/Users/Hildebrand/Documents/PlatformIO/Projects/181022-220018-espidf-hello-world/.pioenvs/esp32dev/firmware.elf...
done.
PlatformIO Unified Debugger > http://bit.ly/pio-debug
PlatformIO: Initializing remote target...
Open On-Chip Debugger 0.10.0-dev (2018-09-20-12:54)
Licensed under GNU GPL v2
For bug reports, read
	http://openocd.org/doc/doxygen/bugs.html
none separate
adapter speed: 20000 kHz
esp32 interrupt mask on
Info : tcl server disabled
Info : telnet server disabled
Error: libusb_open() failed with LIBUSB_ERROR_NOT_SUPPORTED
Info : ftdi: if you experience problems at higher adapter clocks, try the command "ftdi_tdo_sample_edge falling"
Info : clock speed 20000 kHz
Error: JTAG scan chain interrogation failed: all ones
Error: Check JTAG interface, timings, target power, etc.
Error: Trying to use configured scan chain anyway...
Error: esp32.cpu0: IR capture error; saw 0x1f not 0x01
Warn : Bypassing JTAG setup events due to errors
Info : esp32: Debug controller was reset (pwrstat=0xFF, after clear 0xFF).
Info : esp32: Core was reset (pwrstat=0xFF, after clear 0xFF).
Error: cpu0: esp32_fetch_all_regs (line 225): DSR (FFFFFFFF) indicates target still busy!
Error: cpu0: esp32_fetch_all_regs (line 225): DSR (FFFFFFFF) indicates DIR instruction generated an exception!
Error: cpu0: esp32_fetch_all_regs (line 225): DSR (FFFFFFFF) indicates DIR instruction generated an overrun!
Error: cpu0: esp32_fetch_all_regs (line 255): DSR (FFFFFFFF) indicates target still busy!
Error: cpu0: esp32_fetch_all_regs (line 255): DSR (FFFFFFFF) indicates DIR instruction generated an exception!
Error: cpu0: esp32_fetch_all_regs (line 255): DSR (FFFFFFFF) indicates DIR instruction generated an overrun!
Error: Exception reading pc!

Info : Target halted. PRO_CPU: PC=0x00000000 (active)    APP_CPU: PC=0x00000000 
Error: cpu0: xtensa_write_memory (line 759): DSR (FFFFFFFF) indicates target still busy!
Error: cpu0: xtensa_write_memory (line 759): DSR (FFFFFFFF) indicates DIR instruction generated an exception!
Error: cpu0: xtensa_write_memory (line 759): DSR (FFFFFFFF) indicates DIR instruction generated an overrun!
Warn : esp32: Failed writing 4 bytes at address 0x3FF5F064, data - a1, 3a, d8, 50, a1, 3a, d8, 50
embedded:startup.tcl:21: Error: 
in procedure 'init' 
in procedure 'ocd_bouncer' 
in procedure 'esp_smp_break_config' 
in procedure 'esp32' called at file "C:/Users/Hildebrand/.platformio/packages/tool-openocd-esp32/share/openocd/scripts/target/esp32.cfg", line 54
in procedure 'ocd_bouncer' 
in procedure 'esp_core_halt' 
in procedure 'esp32' called at file "C:/Users/Hildebrand/.platformio/packages/tool-openocd-esp32/share/openocd/scripts/target/esp32.cfg", line 44
in procedure 'ocd_bouncer' 
at file "embedded:startup.tcl", line 21

Error: cpu0: xtensa_read_memory (line 652): DSR (FFFFFFFF) indicates target still busy!
Error: cpu0: xtensa_read_memory (line 652): DSR (FFFFFFFF) indicates DIR instruction generated an exception!
Error: cpu0: xtensa_read_memory (line 652): DSR (FFFFFFFF) indicates DIR instruction generated an overrun!
Warn : cpu0: Failed reading 4 bytes at address 0x3FF00030
Error: Failed to read target memory (-4)!
cpu0: Current bits set: BreakIn BreakOut RunStallIn DebugModeOut
cpu1: Current bits set: BreakIn BreakOut RunStallIn DebugModeOut
Info : accepting 'gdb' connection from pipe
Error: cpu0: xtensa_read_memory (line 652): DSR (FFFFFFFF) indicates target still busy!
Error: cpu0: xtensa_read_memory (line 652): DSR (FFFFFFFF) indicates DIR instruction generated an exception!
Error: cpu0: xtensa_read_memory (line 652): DSR (FFFFFFFF) indicates DIR instruction generated an overrun!
Warn : cpu0: Failed reading 5960 bytes at address 0x40090000
Error: no working area available, can't alloc space for stub code!
Error: Failed to load stub (-308)!
Error: Algorithm run faied (-308)!
Error: Faied to run flasher stub (-308)!
Warn : Failed to get flash mappings (-308)!
Error: cpu0: xtensa_read_memory (line 652): DSR (FFFFFFFF) indicates target still busy!
Error: cpu0: xtensa_read_memory (line 652): DSR (FFFFFFFF) indicates DIR instruction generated an exception!
Error: cpu0: xtensa_read_memory (line 652): DSR (FFFFFFFF) indicates DIR instruction generated an overrun!
Warn : cpu0: Failed reading 5960 bytes at address 0x40090000
Error: no working area available, can't alloc space for stub code!
Error: Failed to load stub (-308)!
Error: Algorithm run faied (-308)!
Error: Faied to run flasher stub (-308)!
Error: Failed to probe flash, size 0 KB
Error: auto_probe failed
Error: Connect failed. Consider setting up a gdb-attach event for the target to prepare target for GDB connect, or use 'gdb_memory_map disable'.
Error: attempted 'gdb' connection rejected
Error: error during select: Unknown error
Info : Restore debug stubs @ 0 on core0 of target 'esp32'
.pioinit:10: Error in sourced command file:
Remote communication error.  Target disconnected.: No error.

on both, esp-idf and arduino projects I get the message box saying
Failed to launch GDB: .pioinit:10: Error in sourced command file:
Remote communication error. Target disconnected.: No error. (from interpreter-exec console “source .pioinit”)

So probably there is something wrong with ftdi configuration in your system. Which driver did you use for the FTDI’s Interface 0 in the zadig tool?

This is what Zadig shows for Interface 0, it is set to WinUSB:

Interface 1 is FTDIBUS (v2.12.28.0)

Sorry, can’t help you here :frowning_face: Maybe you’d better try the previous openocd versions, another computer. Just to save your time, you can launch openocd directly from the command line, until you see the correct debug probe initialization.
From folder C:\Users\Hildebrand\.platformio\packages\tool-openocd-esp32:

λ bin\openocd.exe -s share\openocd\scripts\ -f share\openocd\scripts\board\esp32-wrover.cfg

Here is my output:

Open On-Chip Debugger 0.10.0-dev (2018-09-20-12:54)
Licensed under GNU GPL v2
For bug reports, read
        http://openocd.org/doc/doxygen/bugs.html
adapter speed: 20000 kHz
esp32 interrupt mask on
Error: libusb_open() failed with LIBUSB_ERROR_NOT_SUPPORTED
Info : ftdi: if you experience problems at higher adapter clocks, try the command "ftdi_tdo_sample_edge falling"
Info : clock speed 20000 kHz
Info : JTAG tap: esp32.cpu0 tap/device found: 0x120034e5 (mfg: 0x272 (Tensilica), part: 0x2003, ver: 0x1)
Info : JTAG tap: esp32.cpu1 tap/device found: 0x120034e5 (mfg: 0x272 (Tensilica), part: 0x2003, ver: 0x1)
Info : Detected debug stubs @ 3ffc2804 on core0 of target 'esp32'
cpu0: Current bits set: BreakIn BreakOut RunStallIn
cpu1: Current bits set: BreakIn BreakOut RunStallIn
1 Like

Thank you all!
After reinstalling and reconfiguring everything again, debugging now works on both my PCs.

1 Like

Hey,
I have same issue, what exactly have you reinstalled? since i have reinstalled vs code and platformio but i still get the error. I have wrover kit as well.