Hello, I see most questions regarding this board are in the professional solutions category but being new and not a professional, I don’t think I should be putting my question there.
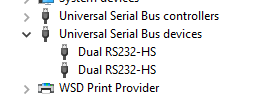
I just bought this board and followed a few videos on how to install this board. Such as the driver install and then the Zadig program. And this board shows up in Device Manager as:
Dual RS232-HS
Dual RS232-HS
Which I have seen while googling so I think everything is good.
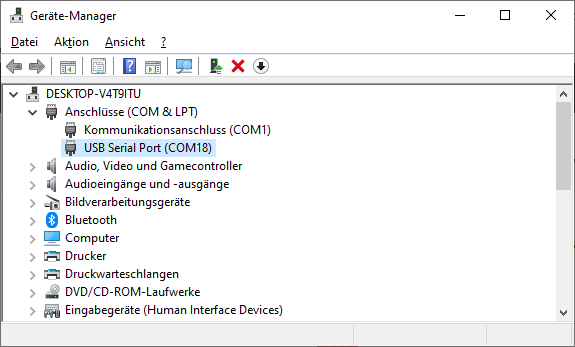
Except, I do not see it under Devices of PlatformIO. I can press Refresh and it is still blank.
I have looked in the forums and googled over a few days now with no success.
I have it connected to an ESP8266 board but I am thinking that the board should so up in Devices regardless of whether it is connected to a target board or not. Is this correct?
The “Devices” tab will show COM port devices. Do you see one COMx device in the windows device manager or under libusb devices? Example
The way you debug an ESP32 with an esp-prog is that you modify only one of the interface of the dual-hs adapter (interface 0) to load with libusb drivers (that will be used for JTAG), keeping the other for UART. So after that, only one device will be visible as a serial device. It will not enumerate the JTAG device.
PlatformIO doesn’t support JTAG debugging of an ESP8266 at this time due to toolchain and hardware constrains (see other forum entries). ESP32 is supported.
Thank you for this information. So it should be showing up in the Ports (COM & LPT) list with a COM port number. I do not get this. Now if I pluug in an ESP device it does show up in the Ports list with a COM port number as expected.
Oh, and thank you for letting me know it will not work for the ESP8266.
I have another question, if there is nothing connected to the ESP-Prog will it still show up with a COM port number? In other words, in your screenshot it is COM18. Is it presently connected to anything?
Thank you - Steve
It should show up. Maybe modify the drivers back to the original ones in Zadig back to FTDIBUS if you’ve changed the driver for both interfaces.
The correct method is also displayed in ESP32 & PIO Unified Debugger - #20 by botofancalin.
No, the USB COM port shows up without the device being connected to anything. The USB device will be there regardless. (Except when you try and power a target device with the serial adapter and it can’t provide enough current so the USB device ejects immediately on overcurrent).
Yes, I have looked at that link and while slightly different I think I am getting the same thing:
But I don’t think it is the FTDI driver I downloaded and when I try to update the driver and browse the FTDI files it says “The best drivers for your device are already installed”.
Then with zadig I do the following:
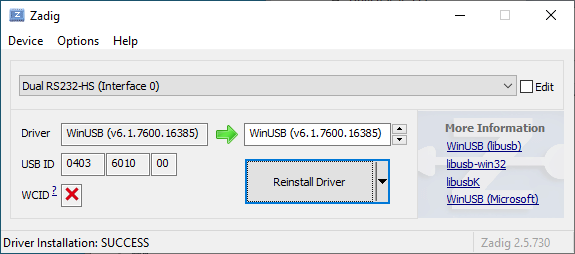
Now from videos I have viewed it shows the driver on the left as FTDIBUS but I don’t get that and do not know how to get that.
ESP-Prog consists of two parts:
- JTAG adapter
- serial/UART adapter
For the JTAG adapter, USB interface 0 is used. For the serial/UART adapter, USB interface 1 is used.
Debugging
For debugging, the JTAG adapter on interface 0 is used.
- Configure interface 0 to use WinUSB/libUSB driver (using Zadig).
- Connect the JTAG pins to the board (plus GND and VCC)
- Optionally, add
debug_tool = esp-prog to platfromio.ini (it’s the default anyway)
- Run the debugger from Visual Studio Code
The JTAG adapter does not appear under Devices. That’s how it’s supposed to be. Furthermore, the board must still be powered separately, e.g. via the USB connector.
Serial Input/Output
On most development boards, the primary serial input/output (UART) is connected to USB-to-serial converter on the development board. So the serial adapter on the ESP-Prog is neither needed nor can it be used for the primary UART.
On custom boards, the serial output can be connected to the serial adapter of ESP-Prog (RX, TX and GND). In order to use it, USB interface 0 must be configured to use the standard FTDI driver.
If properly configured, the serial adapter will be shown on the Devices / Serial tab of PlatformIO.
Your setup
Your screenshot shows that both interfaces are configured for WinUSB. That’s no problem for debugging but a problem for the serial adapter. You can revert from the Device Manager. Select the second Dual RS232-HS device, uninstall its drivers, unplug and replug the ESP-Prog.
If properly configured:
- Interface 0 uses WinUSB
- Interface 1 uses the FTDI driver
1 Like
Manuel, this is an excellent description, thank you.
I only have one ESP32 board and it is from Banggood and so I am not sure how compatible it is? For example, searching it appears that what should be D14 on this board is labelled as D11 on the silkscreen.
Second, I notice the LED is always on as soon as I power the two boards. I suspect it may be connected to one of the debug pins. I am not able to find a schematic for this board.
But I have ordered two different types of boards and I think I have to wait until they come in.
Thank you to everyone who helped me.
Do you have a picture of the board? Or a link to Banggood?
If you have a multimeter, you can try to figure out if a pin is correctly labelled or not. Just look up the data sheet of the Espressif chip or module to identify D14 (on the chip or module) and then probe all pins of the board in continuity mode.
Sorry Manuel, I did not see your reply. However I did get another ESP from Banggood and it is this one:
https://www.banggood.com/ESP32-WiFi-±bluetooth-Development-Board-Ultra-Low-Power-Consumption-Dual-Core-ESP-32-ESP-32S-Similar-ESP8266-Geekcreit-for-Arduino-products-that-work-with-official-Arduino-boards-p-1175488.html?rmmds=myorder&cur_warehouse=CN
As you suggested I found the pinout for the actual ESP32 which has pins on three of the four sides and verified I am on the correct pins.
But when I go to debug I get the following error: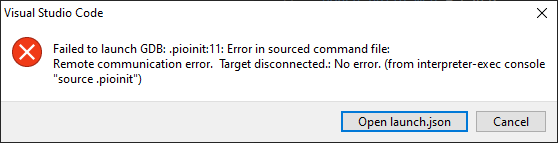
Interestingly in the Board Explorer the only WROOM is an ESP8266. Is the issue that PlatformIO does not support the WROOM series?
You have purchased one of the most popular ESP32 dev boards. It’s well supported in PlatformIO by different board definition, e.g. esp32doit-devkit-v1 (DOIT ESP32 DEVKIT V1).
Please show your platformio.ini file and the output of the DEBUG CONSOLE view to help investigate your issue.
I have tried different ESP32 with no luck. This is the present platformio.ini:
; PlatformIO Project Configuration File
;
;   Build options: build flags, source filter
;   Upload options: custom upload port, speed and extra flags
;   Library options: dependencies, extra library storages
;   Advanced options: extra scripting
;
; Please visit documentation for the other options and examples
; https://docs.platformio.org/page/projectconf.html


[env:esp-wrover-kit]
platform = espressif32
board = esp-wrover-kit

framework = arduino
debug_tool = esp-prog
debug_init_break = tbreak setup
And DEBUG CONSOLE:
Processing esp-wrover-kit (platform: espressif32; board: esp-wrover-kit; framework: arduino)

--------------------------------------------------------------------------------

Verbose mode can be enabled via `-v, --verbose` option

CONFIGURATION: https://docs.platformio.org/page/boards/espressif32/esp-wrover-kit.html

PLATFORM: Espressif 32 (3.0.0) > Espressif ESP-WROVER-KIT

HARDWARE: ESP32 240MHz, 320KB RAM, 4MB Flash

DEBUG: Current (esp-prog) On-board (ftdi) External (esp-prog, iot-bus-jtag, jlink, minimodule, olimex-arm-usb-ocd, olimex-arm-usb-ocd-h, olimex-arm-usb-tiny-h, olimex-jtag-tiny, tumpa)

PACKAGES:

- framework-arduinoespressif32 3.10004.210126 (1.0.4)
I have a question, I only need one USB cable to the ESP-prog and nothing to my ESP32 board. Is this correct?
Thank you.
Sorry, this is all of DEBUG CONSOLE:
Processing esp-wrover-kit (platform: espressif32; board: esp-wrover-kit; framework: arduino)
--------------------------------------------------------------------------------
Verbose mode can be enabled via `-v, --verbose` option
CONFIGURATION: https://docs.platformio.org/page/boards/espressif32/esp-wrover-kit.html
PLATFORM: Espressif 32 (3.0.0) > Espressif ESP-WROVER-KIT
HARDWARE: ESP32 240MHz, 320KB RAM, 4MB Flash
DEBUG: Current (esp-prog) On-board (ftdi) External (esp-prog, iot-bus-jtag, jlink, minimodule, olimex-arm-usb-ocd, olimex-arm-usb-ocd-h, olimex-arm-usb-tiny-h, olimex-jtag-tiny, tumpa)
PACKAGES:
 - framework-arduinoespressif32 3.10004.210126 (1.0.4)
 - tool-esptoolpy 1.30000.201119 (3.0.0)
 - toolchain-xtensa32 2.50200.80 (5.2.0)
LDF: Library Dependency Finder -> http://bit.ly/configure-pio-ldf
LDF Modes: Finder ~ chain, Compatibility ~ soft
Found 26 compatible libraries
Scanning dependencies...
No dependencies
Building in debug mode
Retrieving maximum program size .pio\build\esp-wrover-kit\firmware.elf
Checking size .pio\build\esp-wrover-kit\firmware.elf
Advanced Memory Usage is available via "PlatformIO Home > Project Inspect"
RAM:   [          ]   4.7% (used 15356 bytes from 327680 bytes)
Flash: [==        ]  16.1% (used 210927 bytes from 1310720 bytes)
========================= [SUCCESS] Took 2.85 seconds =========================
Reading symbols from c:\Users\Steve\Documents\PlatformIO\Projects\ESP32\Debugger\.pio\build\esp-wrover-kit\firmware.elf...
done.
PlatformIO Unified Debugger -> http://bit.ly/pio-debug
PlatformIO: debug_tool = esp-prog
PlatformIO: Initializing remote target...
Open On-Chip Debugger  v0.10.0-esp32-20201202 (2020-12-02-17:38)
Licensed under GNU GPL v2
For bug reports, read
	http://openocd.org/doc/doxygen/bugs.html
adapter speed: 20000 kHz

WARNING: boards/esp32-wrover.cfg is deprecated, and may be removed in a future release.
         If your board is ESP32-WROVER-KIT, use board/esp32-wrover-kit-1.8v.cfg instead.
Info : FreeRTOS creation
Info : FreeRTOS creation
adapter speed: 5000 kHz

Info : tcl server disabled
Info : telnet server disabled
Error: libusb_open() failed with LIBUSB_ERROR_NOT_SUPPORTED
Info : clock speed 5000 kHz
Error: JTAG scan chain interrogation failed: all ones
Error: Check JTAG interface, timings, target power, etc.
Error: Trying to use configured scan chain anyway...
Error: esp32.cpu0: IR capture error; saw 0x1f not 0x01
Warn : Bypassing JTAG setup events due to errors
Info : accepting 'gdb' connection from pipe
Warn : No symbols for FreeRTOS!
Error: Target not examined yet
Error executing event gdb-attach on target esp32.cpu0:

Error: Target not halted
Error: auto_probe failed
Error: Connect failed. Consider setting up a gdb-attach event for the target to prepare target for GDB connect, or use 'gdb_memory_map disable'.
Error: attempted 'gdb' connection rejected
Error: error during select: Unknown error
.pioinit:11: Error in sourced command file:
Remote communication error.  Target disconnected.: No error.
The possible problems are:
- WROVER modules are different from WROOM modules. So the currently chosen
esp-wrover-kit is certainly not going to work. Use esp32doit-devkit-v1 instead.
- You need to connect both the ESP32 board and the ESP-Prog via USB. ESP-Prog is not able to power the ESP32.
- If you still get the error message
Error: JTAG scan chain interrogation failed: all ones after fixing the above issue, check the wiring between the ESP-Prog and the ESP32 board.
I configured for esp32doit-devkit-v1 and plugged another USB cable to power the board as well as the cable for the ESP-Prog.
And I still get JTAG scan chain interrogation failed: all ones.
So I metered the connections from the back of the ESP-Prog board right to the module on my ESP32 and get continuity.
So the pins I expect to see continuity are:
ESP-Prog board->ESP32 Pin Name->ESP Module Pin Number
TMS/14->GPIO14->PIN 13
TCK/13->GPIO13->PIN 16
TDO/15->GPIO15->PIN 23
TDI/12->GPIO12->PIN 14
And I underlined those pins in red:
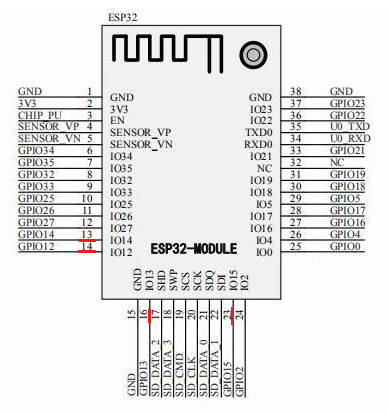
It looks all correct.
So what you can try to do:
- Make sure that you also connect GND of ESP-Prog to GND on ESP32 board.
- Check that the GND pin on the ESP32 board is indeed GND. I have boards that have an incorrectly labelled GND pin.
- Use short cable between ESP-Prog and ESP32 board, and do not connect via breadboard.
- Lower the JTAG speed from 20000 kHz to 1000 kHz. I think the latest PlatformIO just introduced an explicit option for that.
Thank you Manuel, I have tried this and it is still not working, I still get “Error: JTAG scan chain interrogation failed: all ones”.
So I have been playing with this off and on for some time now with a two different type ESP32 boards then I ordered a third type and it still does not work.
I am thinking of just throwing it all in a drawer and maybe I might try playing with it again sometime in the future.
Thank you for your help.
Send an image of your setup. Maybe we can spot a problem…
The good news is that it is working! The bad news is I don’t know why?
So, what happened is I got another ESP32 board in which is different again from the other three types I have tried. So, I decided to try it and it works.
I don’t know if there are bizarre things with all the other boards or not because I have connected it the same as the others.
So, my plan is to not touch it while I take my time and play with Platformio and get comfortable with how the debugger works.
Because not knowing how the debugger works was adding to the difficulty of getting it going.
Once I feel bold enough I will try going back to the other boards to see if they really don’t work or if it is something else. What is interesting is the actual ESP32 module looks to be the same on all variations that I have.
Later on, if I am able to identify why it was not working I will come back here and post my findings.
Thank you manuelbl for your patience when I ran out.
I have both as Win Drivers. So as you suggested I clicked ‘uninstall device’ from the device manager for Interface 1, then unplugged and plugged the esp-prog again. But sadly the driver for interface 1 is coming again as Win Driver and not as FTDI. Any idea how to circumvent this issue.