Sadly I can’t reproduce this issue.
I’ve installed the latest Kubuntu 20.10 in VirtualBox, updated it, installed guest extensions, and installed VSCode via the repo. I used a normal ESP32 Dev board (not the esp-wrover-kit, which don’t have, but one with a normal WROOM32 module) and used my Adafruit FT232H board as a debugger (the esp-prog has a FT2332H with double the channels, but works interchangably). I’ve taken the pinout from this article regarding “Generic FT232H Board” (without the modifications to the .cfg file though, they were already present).
I used the platformio.ini:
[env:esp32dev]
platform = espressif32
board = esp32dev
framework = arduino
upload_protocol = esp-prog
debug_tool = esp-prog
debug_init_break = tbreak setup
debug_speed = 500
The debug_speed = 500 was added to improve stability, the cables I’m using can’t do 20MHz speeds…
And of course I passed on the FT232H USB device onto the VM.
In the beginning debugging failed to launch with error messages in the “Debug Console” saying
undefinedpiogdb: error while loading shared libraries: libncurses.so.5: cannot open shared object file: No such file or directory
undefinedpiogdb: error while loading shared libraries: libpython2.7.so.1.0: cannot open shared object file: No such file or directory
But this was solved by installing the msising libraries per command in Problem with esp32 debug for Ubuntu. (undefined symbol: _Py_ZeroStruct) - #13 by maxgerhardt.
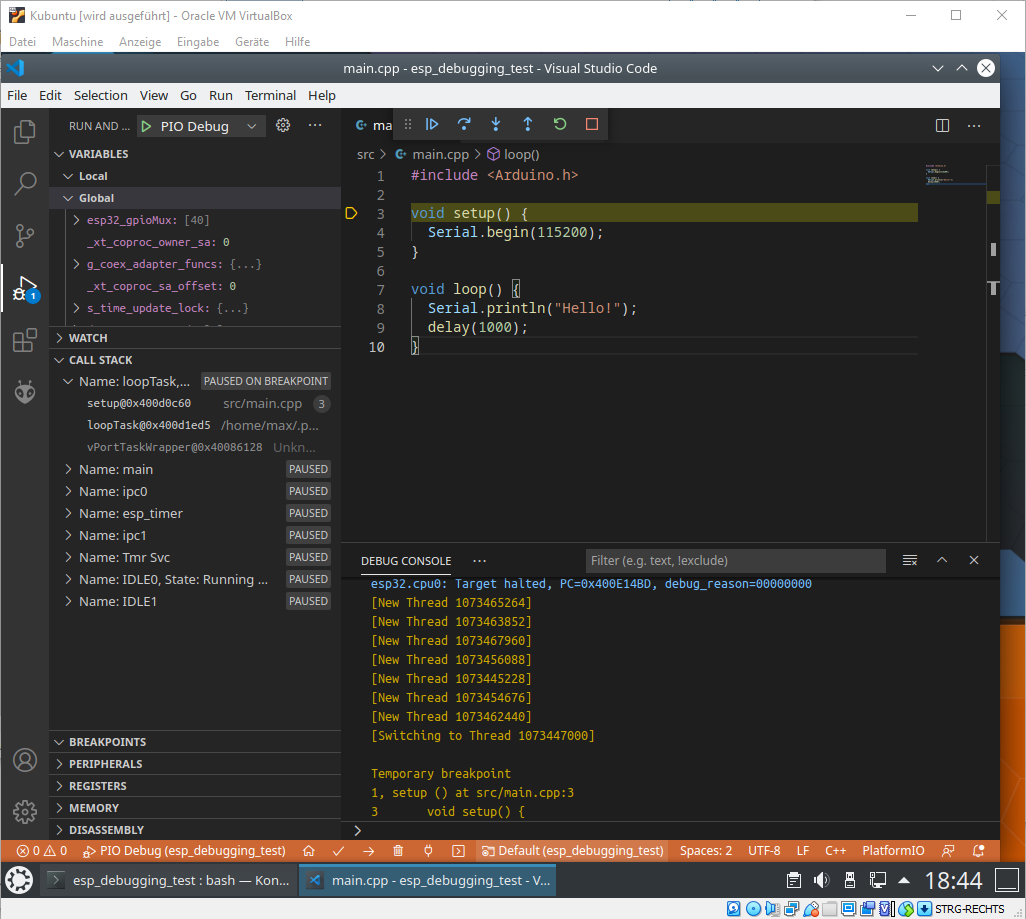
After that, I just pressed the start debugging button without placing any breakpoints. (The ESP32 has a limited number of breakpoints, 2, so I don’t want to pre-allocate those).
And after pressing debugging I could switch to the “Debug Console” tab and saw that it was busy programming the ESP32
Info : esp32.cpu0: Target halted, PC=0x40091856, debug_reason=00000001
esp32.cpu0: Target halted, PC=0x40091856, debug_reason=00000001
** Verified OK **
** Verified OK **
Info : JTAG tap: esp32.cpu0 tap/device found: 0x120034e5 (mfg: 0x272 (Tensilica), part: 0x2003, ver: 0x1)
Info : JTAG tap: esp32.cpu1 tap/device found: 0x120034e5 (mfg: 0x272 (Tensilica), part: 0x2003, ver: 0x1)
JTAG tap: esp32.cpu0 tap/device found: 0x120034e5 (mfg: 0x272 (Tensilica), part: 0x2003, ver: 0x1)
JTAG tap: esp32.cpu1 tap/device found: 0x120034e5 (mfg: 0x272 (Tensilica), part: 0x2003, ver: 0x1)
Info : esp32.cpu0: Debug controller was reset.
esp32.cpu0: Debug controller was reset.
Info : esp32.cpu0: Core was reset.
esp32.cpu0: Core was reset.
Info : esp32.cpu0: Target halted, PC=0x500000CF, debug_reason=00000000
…
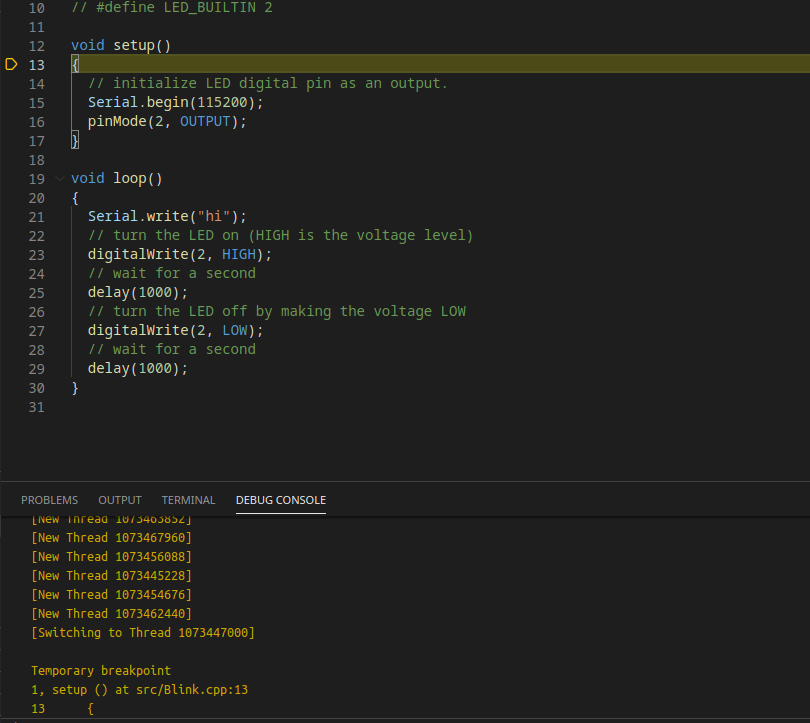
And after some time (maybe 10-15 seconds), that was done and the chip hit the breakpoint.
I find it weird that you do not get any output in the debug console. Have you yet tried with a fresh VSCode installation not no other plugins besides C/C++ by Microsoft and PlatformIO?