I am using a ESP-WROVER-KIT-VB and the docs say that it " has on-board debug probe and IS READY for debugging. You don’t need to use/buy external debug probe", which is why I bought it.
I saw no error messages during install, but when I build and try to debug, I get
Reading symbols from g:_PlatformIo\ESP-WROVER-KIT-VB\NTP_demo.pio\build\esp-wrover-kit\firmware.elf…
done.
PlatformIO Unified Debugger → Redirecting...
PlatformIO: debug_tool = ftdi
PlatformIO: Initializing remote target…
Open On-Chip Debugger v0.10.0-esp32-20190708 (2019-07-08-11:04)
Licensed under GNU GPL v2
For bug reports, read OpenOCD: Bug Reporting
none separate
adapter speed: 20000 kHz
Info : Configured 2 cores
esp32 interrupt mask on
Info : tcl server disabled
Info : telnet server disabled
Error: libusb_open() failed with LIBUSB_ERROR_NOT_SUPPORTED
Error: libusb_open() failed with LIBUSB_ERROR_NOT_FOUND
Error: no device found
Error: unable to open ftdi device with vid 0403, pid 6010, description ‘', serial '’ at bus location ‘*’
Warn : Flash driver of esp32.flash does not support free_driver_priv()
Warn : Flash driver of irom does not support free_driver_priv()
Warn : Flash driver of drom does not support free_driver_priv()
.pioinit:11: Error in sourced command file:
Remote communication error. Target disconnected.: No error.
Does anyone know how I can get debuggin working? Thanks in advance
I think I must have had a brainfart with the jumpering. I probably thought somehting like “onbaord debugger, so no JTAG prob, so leave jumpers at Enable UART communication, rather than Enable JTAG functionality”.
I have now jumpered it to Enable JTAG functionality, and - Yay !! - it hits my breakpoint!
Thank you so very, very much!
Btw, does this mean that I can’t use Serial.print() any more (I don’t need to, if I can breakpoint), or can I also jumper for Enable UART communication too?
As can be seen in the PIO forum topic which I have linked above, the on-board debugger is a 2-channel FT2232 chip. Channel 1 can be jumpered to the JTAG and channel 2 can be jumpered to the UART (which it is by default), and they both work at the same time independently. So keep the ‘Enable UART’ jumpers in place for RXD and TXD. That’s why the post also says to only change the ‘Interface 0’ USB device and not the ‘Interface 1’ one, because that’s the UART you’re using to upload the firmware.
Seems I have something like this.
Error message is:
Error: libusb_open() failed with LIBUSB_ERROR_NOT_SUPPORTED
Error: failed to reset FTDI device: LIBUSB_ERROR_PIPE
Error: unable to open ftdi device with vid 0403, pid 6010, description ‘', serial '’ at bus location ‘’
Error: no device found
Error: unable to open ftdi device with vid 0403, pid 6014, description '’, serial ‘’ at bus location '’
Assertion failed!
I have read all above and to summarize my situation:
Running ESP-WROVER-kit
JTAG jumpers are set
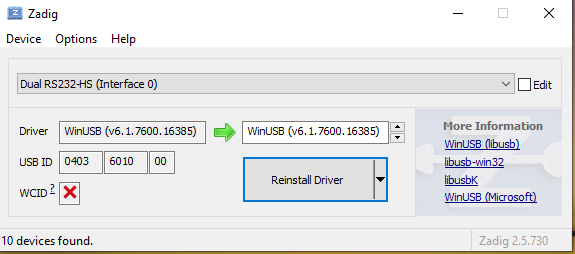
ZADIG tool run - and Comport 34 is Dual RS232-HS on Interface 1 upload port (USB\VID_0403&PID_6010&MI_01 (libwdi autogenerated)
with
ZADIG Interface 0 is USB\VID_0403&PID_6010&MI_00 (libwdi autogenerated)
My platform.ini is:
[env]
platform = espressif32
framework = arduino, espidf
monitor_speed = 115200
platform_packages =
; use a special branch
framework-arduinoespressif32 @ GitHub - marcovannoord/arduino-esp32: Arduino core for the ESP32
;[env:esp32dev]
;board = esp32dev
[env:esp-wrover-kit]
board = esp-wrover-kit
debug_tool = ftdi
debug_init_break = tbreak setup
I do get another compilation error but I think the above needs to be solved first (Failed to launch GDB: .pioinit11 etc…)
It seems that pid 6014 is requested (why?) but does not exist
OpenOCD tries both PID 6010 and 6014 as both PIDs are used by suitable FTDI chips. The error messages are somewhat misleading.
Since libusb cannot open the device for PID 6010, you likely have an incorrect driver installed on interface 0. From your description, it’s not clear which one it is. Please post of a screenshot of Zadig (with interface 0 selected) or try to install the libusb driver using Zadig.
The specific error message “failed to reset FTDI device” is quite rare. Widsom on the internet has it that it might be an invalid driver for interface 0 interfering with interface 1. Can you try to install to official FTDI drivers for the device and then reinstall WinUSB for interface 0? Interface 1 should then be using the FTDI driver. No guarantee though that it works.
YES YES YES !!! - something happened. I would mark this as solution solved if I knew how… !!! I cannot describe how glad I am for your eminent world class support - for three problems up till now.
First I deleted the device and I was asked if I wanted to remove the driver. Yes - I did that. Then I reinstalled the driver (twice - the first try was not succesfull) and ran the project again. Now - the “libusb_open() failed with LIBUSB_ERROR_NOT_SUPPORTED” is still there - BUT - suddenly debugging works.
When I start the project the debugging messages are:
Info : tcl server disabled
Info : telnet server disabled
Error: libusb_open() failed with LIBUSB_ERROR_NOT_SUPPORTED
Info : clock speed 5000 kHz
Info : JTAG tap: esp32.cpu0 tap/device found: 0x120034e5 (mfg: 0x272 (Tensilica), part: 0x2003, ver: 0x1)
Info : JTAG tap: esp32.cpu1 tap/device found: 0x120034e5 (mfg: 0x272 (Tensilica), part: 0x2003, ver: 0x1)
Info : esp32.cpu0: Detected debug stubs @ 3ffb41e4
Info : accepting ‘gdb’ connection from pipe
Warn : No symbols for FreeRTOS!
Info : esp32.cpu0: Target halted, PC=0x4013FCDE, debug_reason=00000000
Info : Set GDB target to ‘esp32.cpu0’… etc…
May I ask:
Info : JTAG tap: esp32.cpu0 tap/device found: 0x120034e5 (mfg: 0x272 (Tensilica), part: 0x2003, ver: 0x1)
Info : JTAG tap: esp32.cpu1 tap/device found: 0x120034e5 (mfg: 0x272 (Tensilica), part: 0x2003, ver: 0x1)
These are two separate thing. The USB interface 0 is used by the debugger to communicate with the ESP32 MCU. The MCU has 2 CPU cores. A single debugger connection can handle both of them. So USB interface 0 is involved only.
The remaining error message (Error: libusb_open() failed with LIBUSB_ERROR_NOT_SUPPORTED) is due to trying two different USB product IDs. It’s poor error handling by OpenOCD.
Hi, thank you so much, I searched many many web pages about “Error: libusb_open() failed with LIBUSB_ERROR_NOT_SUPPORTED”, and finally found your post, the right answer.
Best regards.