Does the Unified Debugger have the ability to set a breakpoint based on accessing a memory location or a variable?
I just started using the debugger from VSCode on a STM32F407 based board.
I have been using Segger’s Ozone. The memory breakpoint is the only major tool that is apparently missing in the Unified Debugger.
I love the Variables and Peripherals windows.
Don’t know if VSCode supports that feature, but for what the documentation says it looks like GDB already has support for it with the watch, rwatch and awatch commands.
Now, as the Unified Debugger was built over GDB, then just use the debug terminal with the stated commands like was explained here.
Is there a GUI front end for GDB?
I was able to use GDB in the Debug Console to set an awatch breakpoint and prove it worked.
Reminded me of debugging a TI9900 back in the early 80s. Never want to go back to those tools.
See discussion at Debugging Feather ESP32: missing peripherals information, watch variables, number of breakpoints. VSCode says it supports this but apparently doesn’t / for another language?
You can also try other IDEs like CLion or Eclipse etc.
Indeed looks like VSCode already supports them, I found something here.
1 Like
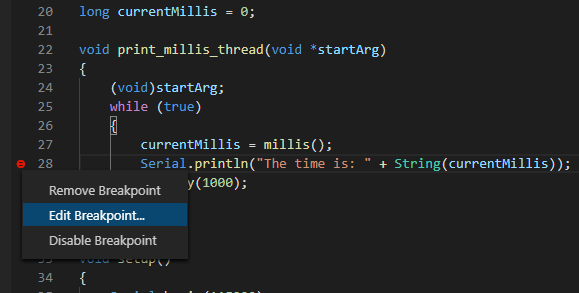
Addendum: When you right-click a breakpoint you can choose ‘Edit breakpoit’ after which you can enter the condition on when to break.
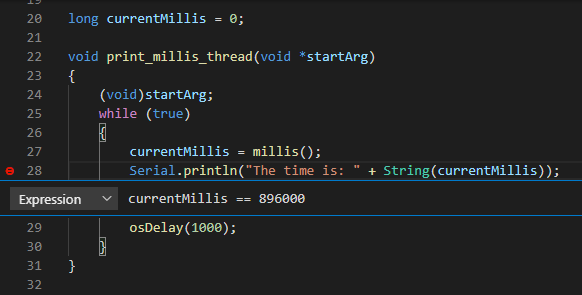
And yes, it works.