Hi,
First of all thanks for the great IDE and all the effort you put into it!
My environment looks like this:
macOS Catalina 10.15.4
Visual Studio Code 1.45.1
PlatformIO Core 4.3.3 Home 3.2.2
Probe: Segger J-Link EDU / SW V6.72d
Hardware: Adafruit Feather ESP32
I successfully wired everything up to debug the Feather ESP32.
Debugging works great, but I run into the following issues:
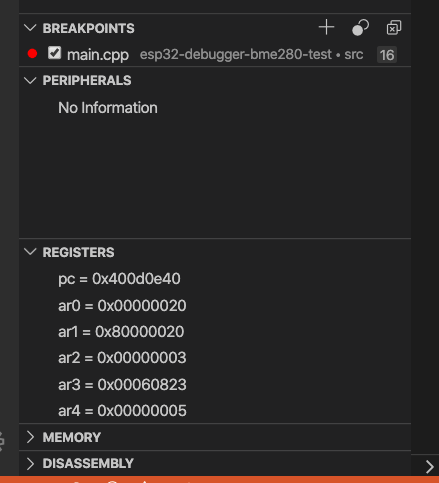
- If a breakpoint is hit, variables, watches breakpoints and registers are displayed, but the peripherals view always shows “No Information” for an ESP32. Is this not yet implemented?
-
Is there a way to set a watch on a variable directly in the IDE, such that execution stops when the variable is changed (Similar to execute “watch ” in the debug console?
-
If I define more than two breakpoints I get the following error message:
Warn : xtensa_add_breakpoint: max HW slot reached, slot=2
Info : Target halted. PRO_CPU: PC=0x400EBD1A             APP_CPU: PC=0x400916EE (active)
Info : Target halted. PRO_CPU: PC=0x400EBD1A             APP_CPU: PC=0x400D0ECE (active)
Target halted. PRO_CPU: PC=0x400EBD1A             APP_CPU: PC=0x400D0ECE (active)
Error: cpu0: xtensa_read_memory (line 700): DSR (8000CC19) indicates DIR instruction generated an overrun!
Warn : cpu0: Failed reading 18 bytes at address 0x400d0ebc
Info : Target halted. PRO_CPU: PC=0x400EBD1A             APP_CPU: PC=0x400916EE (active)
It looks like only hardware breakpoints are supported (max 2 available, see Tips and Quirks - ESP32 - — ESP-IDF Programming Guide latest documentation) if the code resides in flash, right? Or did I miss something here?
...OpenOCD: flash (up to 32) and IRAM (up to 32) breakpoints. Currently GDB can not set software breakpoints in flash. So until this limitation is removed those breakpoints have to be emulated by OpenOCD as hardware ones...