Atmega328p xplained mini board: uploading success, can't debug

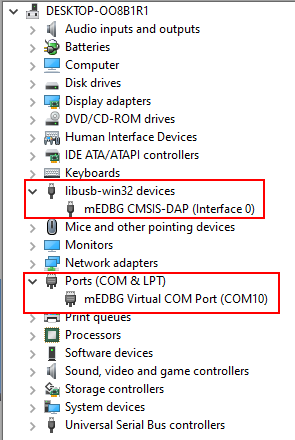
Hi, I have a board atmega328p xplained mini on hand:
image

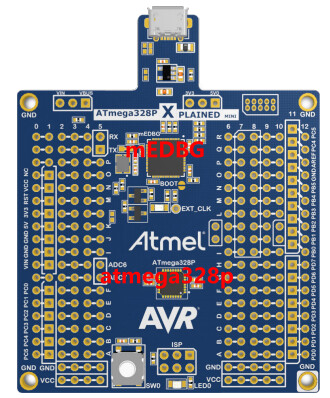
The target chip is atmega328p, and there is a debugger (mEDBG) on the board. The IDE recommended by the microchip is “microchip studio”, but it’s too big and slow.

I want to use Platformio, and find this thread, following the instructions posted in the thread, I uploading the code successfully, thanks @ maxgerhardt.
The instructions for uploading:
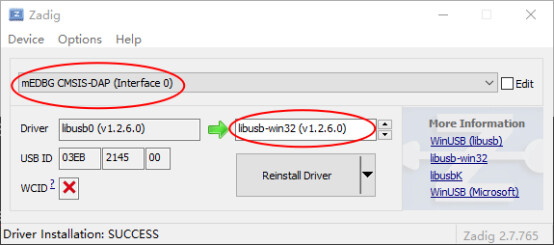
step1: use zadig to change the driver to “libusb-win32”
image

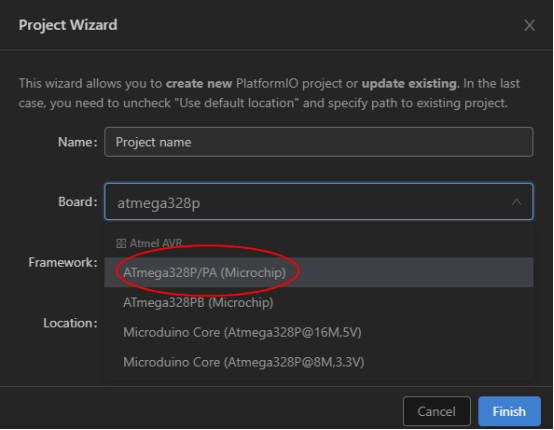
step2: select “ATmega328P/PA(Microchip)” in the drop-down list of the Board when creating the platformio project
image

step3a: for the C code

#include <avr/io.h>
#include <util/delay.h>

int main(void)
{
  DDRD |= 0b00001000;
  while (1)
  {
    PORTD &= 0b11110111;
    _delay_ms(1000);
    PORTD |= 0b00001000;
    _delay_ms(1000);
  }
}

the platformio.ini is:

[env:ATmega328P]
platform = atmelavr
board = ATmega328P
upload_protocol = custom
upload_flags =
    -C
    $PROJECT_PACKAGES_DIR/tool-avrdude/avrdude.conf
    -p
    atmega328p
    -Pusb
    -c
    xplainedmini
    -e
upload_command = avrdude $UPLOAD_FLAGS -U flash:w:$SOURCE:i

step3b: for the arduino code

#include <Arduino.h>

unsigned char i = 0;

void setup()
{
  pinMode(3,OUTPUT);
  Serial.begin(9600);
}

void loop()
{
  digitalWrite(3,HIGH);
  delay(500);
  digitalWrite(3,LOW);
  delay(500);
  Serial.println(i++);
}

the platformio.ini is

[env:ATmega328P]
platform = atmelavr
board = ATmega328P
framework = arduino
upload_protocol = custom
upload_flags =
    -C
    $PROJECT_PACKAGES_DIR/tool-avrdude/avrdude.conf
    -p
    atmega328p
    -Pusb
    -c
    xplainedmini
    -e
upload_command = avrdude $UPLOAD_FLAGS -U flash:w:$SOURCE:i

Both of step3a and step3b can be used for uploading successfully.

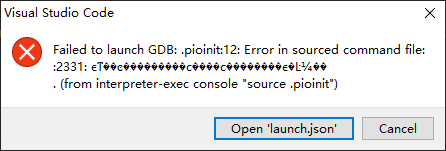
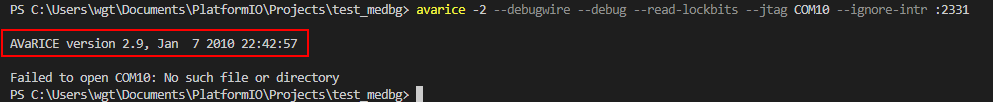
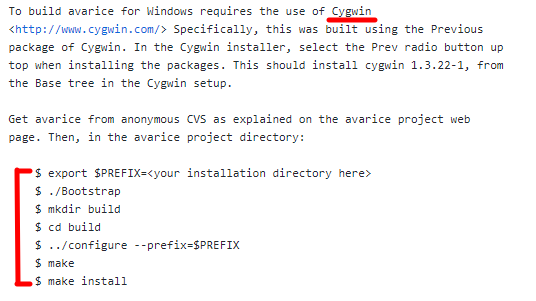
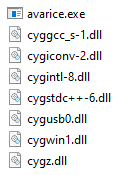
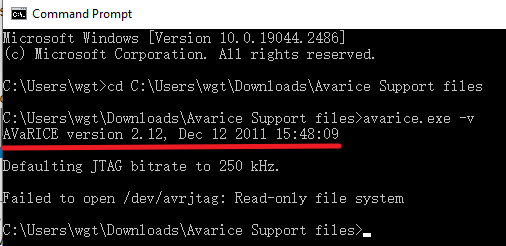
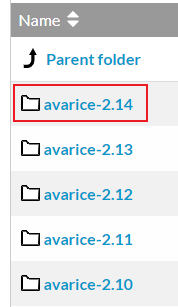
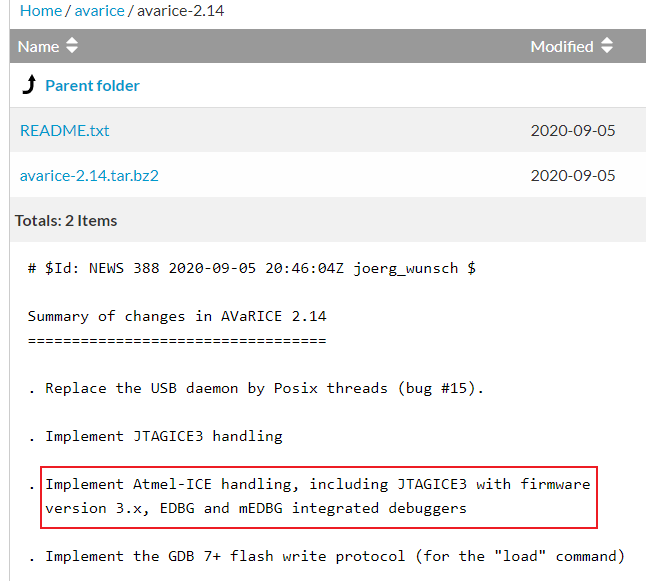
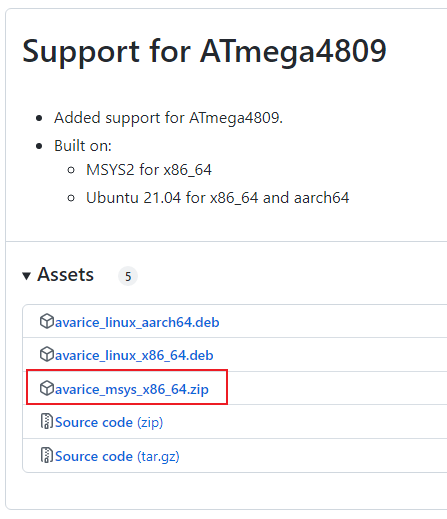
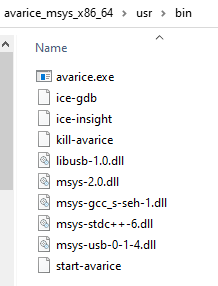
Then I want to debugging, as there is a debugger mEDBG on the board. There is a thread discussing atmega32 debugging on linux, but my OS is windows(10), and the debugger in the thread is avrice, not mEDBG.

I find that the default debugger used for atmega328p supported by platformio is avr-stub, but the atmega328p xplained mini board has a real debugger on board, can anyone tell me some instructions about how to configure platformio.ini to use the on board debugger mEDBG for debugging?

Best regards.

No. The debugger tool / program is called avarice, and that does support mEDBG, at least per

So you give compiling and starting it a try.

Thank you @maxgerhardt
My platformio.ini is:

[env:ATmega328P]
platform = atmelavr
board = ATmega328P
framework = arduino

;for upload
upload_protocol = custom
upload_flags =
    -C
    $PROJECT_PACKAGES_DIR/tool-avrdude/avrdude.conf
    -p
    atmega328p
    -Pusb
    -c
    xplainedmini
    -e
upload_command = avrdude $UPLOAD_FLAGS -U flash:w:$SOURCE:i

;for debug
debug_port = :2331
debug_load_cmds = 
debug_load_mode = manual
debug_tool = custom
debug_init_cmds =
  target remote $DEBUG_PORT
  file "$PROG_PATH"
  load C:\Users\wgt\Documents\PlatformIO\Projects\test_medbg\.pio\build\ATmega328P\firmware.elf
debug_server = 
  avarice
  -1 
  -COM10 
  --ignore-intr 
  :2331

Uploading successfully, but when clicking the debug button, about a few seconds later, an error occured:
1
And the message in “DEBUG CONSOLE” is:

 undefinedUsage: /cygdrive/d/WinAVR-20100110/bin/avarice [OPTION]... [[HOST_NAME]:PORT]

Options:
  -h, --help                  Print this message.
  -1, --mkI                   Connect to JTAG ICE mkI (default)
  -2, --mkII                  Connect to JTAG ICE mkII
  -B, --jtag-bitrate <rate>   Set the bitrate that the JTAG box communicates
                                with the avr target device. This must be less
                                than 1/4 of the frequency of the target. Valid
                                values are 1000/500/250/125 kHz (mkI),
                                or 22 through 6400 kHz (mkII).
                                (default: 250 kHz)
  -C, --capture               Capture running program.
                                Note: debugging must have been enabled prior
                                to starting the program. (e.g., by running
                                avarice earlier)
  -c, --daisy-chain <ub,ua,bb,ba> Daisy chain settings:
                                <units before, units after,
                                bits before, bits after>
  -D, --detach                Detach once synced with JTAG ICE
  -d, --debug                 Enable printing of debug information.
  -e, --erase                 Erase target.
  -E, --event <eventlist>     List of events that do not interrupt.
                                JTAG ICE mkII and AVR Dragon only.
                                Default is "none,run,target_power_on,target_sleep,target_wakeup"
  -f, --file <filename>       Specify a file for use with the --program and
                                --verify options. If --file is passed and
                                neither --program or --verify are given then
                                --program is implied.
  -g, --dragon                Connect to an AVR Dragon rather than a JTAG ICE.
                                This implies --mkII, but might be required in
                                addition to --debugwire when debugWire is to
                                be used.
  -I, --ignore-intr           Automatically step over interrupts.
                                Note: EXPERIMENTAL. Can not currently handle
                                devices fused for compatibility.
  -j, --jtag <devname>        Port attached to JTAG box (default: /dev/avrjtag).
  -k, --known-devices         Print a list of known devices.
  -L, --write-lockbits <ll>   Write lock bits.
  -l, --read-lockbits         Read lock bits.
  -P, --part <name>           Target device name (e.g. atmega16)

  -p, --program               Program the target.
                                Binary filename must be specified with --file
                                option.
  -r, --read-fuses            Read fuses bytes.
  -R, --reset-srst            External reset through nSRST signal.
  -V, --version               Print version information.
  -v, --verify                Verify program in device against file specified
                                with --file option.
  -w, --debugwire             For the JTAG ICE mkII, connect to the target
                                using debugWire protocol rather than JTAG.
  -W, --write-fuses <eehhll>  Write fuses bytes.
  -x, --xmega                 AVR part is an ATxmega device.
HOST_NAME defaults to 0.0.0.0 (listen on any interface).
":PORT" is required to put avarice into gdb server mode.

e.g. /cygdrive/d/WinAVR-20100110/bin/avarice --erase --program --file test.bin --jtag /dev/ttyS0 :4242

Reading symbols from c:\Users\wgt\Documents\PlatformIO\Projects\test_medbg\.pio\build\ATmega328P\firmware.elf...
done.
PlatformIO Unified Debugger -> https://bit.ly/pio-debug
PlatformIO: debug_tool = custom
PlatformIO: Initializing remote target...
.pioinit:12: Error in sourced command file:
:2331: ϵͳ��ͼ���������ϲ����ϲ��������ϵ�Ŀ¼��
.

Can you guide me through this test?
Best regards.

For giving it the COM port you should try --jtag <port> like the help text says, so

debug_server = 
  avarice
  -1 
  --jtag
  COM10 
  --ignore-intr 
  :2331

And not sure if -1 or -2 is right here, try both.

Thank you very much @maxgerhardt
I try both -1 and -2:

[env:ATmega328P]
platform = atmelavr
board = ATmega328P
framework = arduino

;for upload
upload_protocol = custom
upload_flags =
    -C
    $PROJECT_PACKAGES_DIR/tool-avrdude/avrdude.conf
    -p
    atmega328p
    -Pusb
    -c
    xplainedmini
    -e
upload_command = avrdude $UPLOAD_FLAGS -U flash:w:$SOURCE:i

;for debug
debug_port = :2331
debug_load_cmds = 
debug_load_mode = manual
debug_tool = custom
debug_init_cmds =
  target remote $DEBUG_PORT
  file "$PROG_PATH"
  load C:\Users\wgt\Documents\PlatformIO\Projects\test_medbg\.pio\build\ATmega328P\firmware.elf
debug_server = 
  avarice
  -1 ;or -2
  --jtag
  COM10 
  --ignore-intr 
  :2331

An error occured:

Reading symbols from c:\Users\wgt\Documents\PlatformIO\Projects\test_medbg\.pio\build\ATmega328P\firmware.elf...
done.
PlatformIO Unified Debugger -> https://bit.ly/pio-debug
PlatformIO: debug_tool = custom
PlatformIO: Initializing remote target...
.pioinit:12: Error in sourced command file:
:2331: ϵͳ��ͼ���������ϲ����ϲ��������ϵ�Ŀ¼��

The target mcu is atmega328p, and the debug protocol supported by it is debugWIRE, does it need to switch between ISP and debugWIRE mode?

And the “2331” of “debug_port = :2331” has special meaning? Can I change it to some other numbers?

Best regards.

Good point, the DWEN fuse definitely has to be programmed correctly or the chip will not be seen. avarice also has the

option. Let’s take a small step back.

What’s the output when you run

avarice -2 --debugwire --debug --read-lockbits --jtag COM10 --ignore-intr :2331

in a terminal?

Hi, @maxgerhardt , sorry, I’m late.
After running

avarice -2 --debugwire --debug --read-lockbits --jtag COM10 --ignore-intr :2331

the output is:

Then COM10 isn’t the right port for the mEDG. What does the device manager say about available COM ports?

@maxgerhardt
The device manager is:
image

Due to a Windows quirk you might have to give the COM port in another format for COM n >= 10. Can you try

\\.\COM10

instead of COM10?

Thanks.
The output is:

Well that doesn’t seem to be working well. I’ll test on my on hardware when it gets here.

Thank you for your help.
Best regards.

By the way, do you have a atmega328p xplained mini board?

I don’t yet, that’s why I bought one. But they’re cheap.

Great.
I hope this problem can be solved completely, which will end a series of similar thread in the forum.

Actually the low version / date seems to be a problem. As you can see in

there should be options for -3 and even -4, but your version only gives up to -2.

Did you make sure to compile the version from source at GitHub - avrdudes/avarice: AVaRICE is a program for interfacing the Atmel JTAG ICE to GDB to allow users to debug their embedded AVR target.?

In the doc of avarice, I following the steps to build avarice.exe:
image

step1: install cygwin

step2:

$ export $PREFIX=<your installation directory here>

ok, no problem:
image

step3:

$ ./Bootstrap

terrible error:
image

I don’t know how to solve the problem in the step3, so I searched many webs, and finding that the solutions are for linux, I tried them in cygwin terminal, not surprisingly, all of them failed.

Hi, I found an avarice.exe in avrfreaks,
image

image

And the version the avarice.exe is 2.12:
image

But the latest version of avarice is:
image
No .exe (2.14) file included in the folder.

The 2.14 version of avarice may help solve the problem:

So…the next step is: how to build it?

P.S. There is some releases,
for the last pre-built windows binaries (2.14.x):


image

When running avarice.exe:
image
then some errors occured, it says that missing some msys-xxx.dll files. With great effort, I find some msys-xxx.dll files, as the picture illustrated above, but there is one error still exists: missing “msys-hidapi-0.dll”, I can’t find it in the webs. If someone want to get the msys-xxx.dll files exists in the picture above, please click the following link:

I’ve managed to compile GitHub - walx666/avarice to a single .exe, libusb and libhid seem to be statically linked in it.

Does that run?

C:\Users\Max>C:\Users\Max\Downloads\avarice-main\build\x64\Release\avarice.exe --version
AVaRICE version 2.14svn20200906, Jan 14 2023 18:13:44
``´

Actually I also managed to compile it in MSYS2/MSYS, see https://github.com/maxgerhardt/avarice/suites/10374016246/artifacts/511730736, I’ve opened a PR in

to build it automatically.

I could not yet test on real hardware. When using the MSYS2/MSYS compatibility layer, one might have to give the serial port in different ways, like COM10 → /dev/ttyS9 (COM1 is /dev/ttyS0).