Unable to use FTDI Chip to debug ESP-WROVER-KIT

Able to download firmware but unable to debug. According to doc from platformio and doc from espressif, directly connecting the board to the laptop with USB cable should be fine. Error message from vscode’s debug console is as follows:

Successfully created esp32 image.
========================= [SUCCESS] Took 15.81 seconds =========================
undefinedD:\yzhao\.platformio\packages\toolchain-xtensa-esp32\bin\xtensa-esp32-elf-gdb.exe: warning: Couldn't determine a path for the index cache directory.

Reading symbols from d:\workspace\embedded\ESP-WROVER-KIT\.pio\build\esp-wrover-kit\firmware.elf...
PlatformIO Unified Debugger -> https://bit.ly/pio-debug
PlatformIO: debug_tool = ftdi
PlatformIO: Initializing remote target...
Open On-Chip Debugger  v0.11.0-esp32-20220411 (2022-04-11-08:48)
Licensed under GNU GPL v2
For bug reports, read
	http://openocd.org/doc/doxygen/bugs.html
adapter speed: 20000 kHz

WARNING: boards/esp32-wrover.cfg is deprecated, and may be removed in a future release.
         If your board is ESP32-WROVER-KIT, use board/esp32-wrover-kit-1.8v.cfg instead.
DEPRECATED! use 'adapter speed' not 'adapter_khz'
adapter speed: 5000 kHz

Info : tcl server disabled
Info : telnet server disabled
Error: libusb_open() failed with LIBUSB_ERROR_NOT_FOUND
Error: no device found
Error: unable to open ftdi device with vid 0403, pid 6010, description '*', serial '*' at bus location '*'
Error: no device found
Error: unable to open ftdi device with vid 0403, pid 6014, description '*', serial '*' at bus location '*'

Assertion failed!

Program: D:\yzhao\.platformio\packages\tool-openocd-esp32\bin\openocd.exe
File: ../src/jtag/core.c, Line 338

Expression: jtag_trst == 0
.pioinit:11: Error in sourced command file:
Remote communication error.  Target disconnected.: Success.

No – on Windwos (which your D:\... path in the output suggests), you have to use Zadig to load WinUSB drivers for the JTAG USB part of the ESP-PROG to be able to use it to debug. Please see https://medium.com/@manuel.bl/low-cost-esp32-in-circuit-debugging-dbbee39e508b.

@maxgerhardt Thanks for the reply! I have loaded WinUSB drivers for the JTAG USB, and OpenOCD can find the jtag device now. However, there are new error messages (seems it’s complaining about number of threads? But my main.cpp is very simple and I attached it below):

Successfully created esp32 image.
========================= [SUCCESS] Took 15.10 seconds =========================
undefinedD:\yzhao\.platformio\packages\toolchain-xtensa-esp32\bin\xtensa-esp32-elf-gdb.exe: warning: Couldn't determine a path for the index cache directory.

Reading symbols from d:\workspace\embedded\ESP-WROVER-KIT\.pio\build\esp-wrover-kit\firmware.elf...
PlatformIO Unified Debugger -> https://bit.ly/pio-debug
PlatformIO: debug_tool = ftdi
PlatformIO: Initializing remote target...
Open On-Chip Debugger  v0.11.0-esp32-20220411 (2022-04-11-08:48)
Licensed under GNU GPL v2
For bug reports, read
	http://openocd.org/doc/doxygen/bugs.html
adapter speed: 20000 kHz

WARNING: boards/esp32-wrover.cfg is deprecated, and may be removed in a future release.
         If your board is ESP32-WROVER-KIT, use board/esp32-wrover-kit-1.8v.cfg instead.
DEPRECATED! use 'adapter speed' not 'adapter_khz'
adapter speed: 5000 kHz

Info : tcl server disabled
Info : telnet server disabled
Info : clock speed 5000 kHz
Info : JTAG tap: esp32.cpu0 tap/device found: 0x120034e5 (mfg: 0x272 (Tensilica), part: 0x2003, ver: 0x1)
Info : JTAG tap: esp32.cpu1 tap/device found: 0x120034e5 (mfg: 0x272 (Tensilica), part: 0x2003, ver: 0x1)
Info : esp32.cpu0: Debug controller was reset.
Info : esp32.cpu0: Core was reset.
Info : esp32.cpu1: Debug controller was reset.
Info : esp32.cpu1: Core was reset.
Info : starting gdb server for esp32.cpu0 on pipe
Info : accepting 'gdb' connection from pipe
Info : esp32.cpu0: Target halted, PC=0x400D1AA6, debug_reason=00000000
Info : Set GDB target to 'esp32.cpu0'
Info : esp32.cpu1: Target halted, PC=0x400D1AA6, debug_reason=00000000
Warn : No symbols for FreeRTOS!
Info : esp32.cpu0: Target halted, PC=0x4009260E, debug_reason=00000001
Info : Flash mapping 0: 0x10020 -> 0x3f400020, 116 KB
Info : Flash mapping 1: 0x30018 -> 0x400d0018, 104 KB
Info : esp32.cpu0: Target halted, PC=0x4009260E, debug_reason=00000001
Info : Auto-detected flash bank 'esp32.cpu0.flash' size 4096 KB
Info : Using flash bank 'esp32.cpu0.flash' size 4096 KB
Info : esp32.cpu0: Target halted, PC=0x4009260E, debug_reason=00000001
Info : Flash mapping 0: 0x10020 -> 0x3f400020, 116 KB
Info : Flash mapping 1: 0x30018 -> 0x400d0018, 104 KB
Info : Using flash bank 'esp32.cpu0.irom' size 108 KB
Info : esp32.cpu0: Target halted, PC=0x4009260E, debug_reason=00000001
Info : Flash mapping 0: 0x10020 -> 0x3f400020, 116 KB
Info : Flash mapping 1: 0x30018 -> 0x400d0018, 104 KB
Info : Using flash bank 'esp32.cpu0.drom' size 120 KB
Info : New GDB Connection: 1, Target esp32.cpu0, state: halted
0x400d1aa6 in initArduino () at D:/yzhao/.platformio/packages/framework-arduinoespressif32/cores/esp32/esp32-hal-misc.c:238
238	    if(err == ESP_ERR_NVS_NO_FREE_PAGES || err == ESP_ERR_NVS_NEW_VERSION_FOUND){
Error: Too large number of threads 3689331422!
Loading section .dram0.data, size 0x354c lma 0x3ffbdb60
Loading section .iram0.vectors, size 0x403 lma 0x40080000
Loading section .iram0.text, size 0xd48f lma 0x40080404
Loading section .flash.text, size 0x1cf83 lma 0x400d0020
Warn : address 0x400eb000 not writable
Loading section .rtc.data, size 0x10 lma 0x50000200
.pioinit:12: Error in sourced command file:
Load failed
.pioinit:12: Error in sourced command file:
Load failed

This is my main.cpp:

#include <Arduino.h>

void setup()
{
	// put your setup code here, to run once:
	Serial.begin(115200);
}

void loop()
{
	// put your main code here, to run repeatedly:
	Serial.println("This is main.");
}

Okay, that looks a lot better now but still not completely working.

Can you add debug_init_break = break setup to your platformio.ini and retry debugging? It might have halted the chip at a very weird place where FreeRTOS was not yet initialized.

In the “Debugging” sidebars, there is also not only “PIO Debug” as possible target, but a “without upload” (aka, Attach). Can you let the firmware run normally, then use that target too? Does it attach properly?

@maxgerhardt Thanks. Adding debug_init_break = break setup doesn’t work. It’s outputting the same error message.

I used “PIO Debug (without uploading)” and then:
stage01: seems it’s working, but the program is not stopping at the breakpoint;
stage02: after some seconds, some error message shows up;
stage03: it just outputs error message and doesn’t stop. So I pressed the stop button.

message for stage01:

========================= [SUCCESS] Took 15.23 seconds =========================
undefinedD:\yzhao\.platformio\packages\toolchain-xtensa-esp32\bin\xtensa-esp32-elf-gdb.exe: warning: Couldn't determine a path for the index cache directory.

Reading symbols from d:\workspace\embedded\ESP-WROVER-KIT\.pio\build\esp-wrover-kit\firmware.elf...
PlatformIO Unified Debugger -> https://bit.ly/pio-debug
PlatformIO: debug_tool = ftdi
PlatformIO: Initializing remote target...
Open On-Chip Debugger  v0.11.0-esp32-20220411 (2022-04-11-08:48)
Licensed under GNU GPL v2
For bug reports, read
	http://openocd.org/doc/doxygen/bugs.html
adapter speed: 20000 kHz

WARNING: boards/esp32-wrover.cfg is deprecated, and may be removed in a future release.
         If your board is ESP32-WROVER-KIT, use board/esp32-wrover-kit-1.8v.cfg instead.
DEPRECATED! use 'adapter speed' not 'adapter_khz'
adapter speed: 5000 kHz

Info : tcl server disabled
Info : telnet server disabled
Info : clock speed 5000 kHz
Info : JTAG tap: esp32.cpu0 tap/device found: 0x120034e5 (mfg: 0x272 (Tensilica), part: 0x2003, ver: 0x1)
Info : JTAG tap: esp32.cpu1 tap/device found: 0x120034e5 (mfg: 0x272 (Tensilica), part: 0x2003, ver: 0x1)
Info : esp32.cpu0: Debug controller was reset.
Info : esp32.cpu0: Core was reset.
Info : esp32.cpu1: Debug controller was reset.
Info : esp32.cpu1: Core was reset.
Info : starting gdb server for esp32.cpu0 on pipe
Info : accepting 'gdb' connection from pipe
Info : esp32.cpu0: Target halted, PC=0x400EC2EA, debug_reason=00000000
Info : Set GDB target to 'esp32.cpu0'
Info : esp32.cpu1: Target halted, PC=0x400EC2EA, debug_reason=00000000
Warn : No symbols for FreeRTOS!
Info : esp32.cpu0: Target halted, PC=0x4009260E, debug_reason=00000001
Info : Flash mapping 0: 0x10020 -> 0x3f400020, 47 KB
Info : Flash mapping 1: 0x20020 -> 0x400d0020, 115 KB
Info : esp32.cpu0: Target halted, PC=0x4009260E, debug_reason=00000001
Info : Auto-detected flash bank 'esp32.cpu0.flash' size 4096 KB
Info : Using flash bank 'esp32.cpu0.flash' size 4096 KB
Info : esp32.cpu0: Target halted, PC=0x4009260E, debug_reason=00000001
Info : Flash mapping 0: 0x10020 -> 0x3f400020, 47 KB
Info : Flash mapping 1: 0x20020 -> 0x400d0020, 115 KB
Info : Using flash bank 'esp32.cpu0.irom' size 116 KB
Info : esp32.cpu0: Target halted, PC=0x4009260E, debug_reason=00000001
Info : Flash mapping 0: 0x10020 -> 0x3f400020, 47 KB
Info : Flash mapping 1: 0x20020 -> 0x400d0020, 115 KB
Info : Using flash bank 'esp32.cpu0.drom' size 48 KB
Info : New GDB Connection: 1, Target esp32.cpu0, state: halted
Warn : keep_alive() was not invoked in the 1000 ms timelimit. GDB alive packet not sent! (1002 ms). Workaround: increase "set remotetimeout" in GDB
0x400ec2ea in esp_efuse_get_field_size (field=<optimized out>) at /home/runner/work/esp32-arduino-lib-builder/esp32-arduino-lib-builder/esp-idf/components/efuse/src/esp_efuse_api.c:167
167	/home/runner/work/esp32-arduino-lib-builder/esp32-arduino-lib-builder/esp-idf/components/efuse/src/esp_efuse_api.c: No such file or directory.
Loading section .dram0.data, size 0x354c lma 0x3ffbdb60
Loading section .iram0.vectors, size 0x403 lma 0x40080000
Loading section .iram0.text, size 0xd48f lma 0x40080404
Loading section .rtc.data, size 0x10 lma 0x50000200
Info : JTAG tap: esp32.cpu0 tap/device found: 0x120034e5 (mfg: 0x272 (Tensilica), part: 0x2003, ver: 0x1)
Info : JTAG tap: esp32.cpu1 tap/device found: 0x120034e5 (mfg: 0x272 (Tensilica), part: 0x2003, ver: 0x1)
Info : esp32.cpu0: Debug controller was reset.
Warn : keep_alive() was not invoked in the 1000 ms timelimit. GDB alive packet not sent! (1010 ms). Workaround: increase "set remotetimeout" in GDB
Info : esp32.cpu0: Core was reset.
Info : esp32.cpu0: Target halted, PC=0x500000CF, debug_reason=00000000
Info : esp32.cpu0: Core was reset.
Warn : keep_alive() was not invoked in the 1000 ms timelimit. GDB alive packet not sent! (1002 ms). Workaround: increase "set remotetimeout" in GDB
Info : esp32.cpu0: Target halted, PC=0x40000400, debug_reason=00000000
Info : esp32.cpu1: Debug controller was reset.
Info : esp32.cpu1: Core was reset.
Info : esp32.cpu1: Target halted, PC=0x40000400, debug_reason=00000000
Info : esp32.cpu0: Target halted, PC=0x4009260E, debug_reason=00000001
Info : JTAG tap: esp32.cpu0 tap/device found: 0x120034e5 (mfg: 0x272 (Tensilica), part: 0x2003, ver: 0x1)
Info : JTAG tap: esp32.cpu1 tap/device found: 0x120034e5 (mfg: 0x272 (Tensilica), part: 0x2003, ver: 0x1)
Info : esp32.cpu0: Debug controller was reset.
Warn : keep_alive() was not invoked in the 1000 ms timelimit. GDB alive packet not sent! (1004 ms). Workaround: increase "set remotetimeout" in GDB
Info : esp32.cpu0: Core was reset.
Info : esp32.cpu0: Target halted, PC=0x500000CF, debug_reason=00000000
Info : esp32.cpu0: Core was reset.
Info : esp32.cpu0: Target halted, PC=0x40000400, debug_reason=00000000
Info : esp32.cpu1: Debug controller was reset.
Info : esp32.cpu1: Core was reset.
Info : esp32.cpu1: Target halted, PC=0x40000400, debug_reason=00000000
Info : esp32.cpu0: Target halted, PC=0x4009260E, debug_reason=00000001
Loading section .flash.appdesc, size 0x100 lma 0x3f400020
Loading section .flash.rodata, size 0xbd14 lma 0x3f400120
Loading section .flash.text, size 0x1ce6b lma 0x400d0020
Info : Compressed 48660 bytes to 15405 bytes in 0.002000s
Info : PROF: Data transferred in 77.569 ms @ 193.943 KB/s
Info : esp32.cpu0: Target halted, PC=0x4009260E, debug_reason=00000001
Info : Compressed 118379 bytes to 71097 bytes in 0.003739s
Info : PROF: Data transferred in 395.673 ms @ 175.475 KB/s
Info : esp32.cpu0: Target halted, PC=0x4009260E, debug_reason=00000001
Info : JTAG tap: esp32.cpu0 tap/device found: 0x120034e5 (mfg: 0x272 (Tensilica), part: 0x2003, ver: 0x1)
Info : JTAG tap: esp32.cpu1 tap/device found: 0x120034e5 (mfg: 0x272 (Tensilica), part: 0x2003, ver: 0x1)
Info : esp32.cpu0: Debug controller was reset.
Info : esp32.cpu0: Core was reset.
Info : esp32.cpu0: Target halted, PC=0x500000CF, debug_reason=00000000
Info : esp32.cpu0: Core was reset.
Info : esp32.cpu0: Target halted, PC=0x40000400, debug_reason=00000000
Info : esp32.cpu1: Debug controller was reset.
Warn : keep_alive() was not invoked in the 1000 ms timelimit. GDB alive packet not sent! (1001 ms). Workaround: increase "set remotetimeout" in GDB
Info : esp32.cpu1: Core was reset.
Info : esp32.cpu1: Target halted, PC=0x40000400, debug_reason=00000000
Start address 0x400824f8, load size 236141
Transfer rate: 16 KB/sec, 12428 bytes/write.
Info : JTAG tap: esp32.cpu0 tap/device found: 0x120034e5 (mfg: 0x272 (Tensilica), part: 0x2003, ver: 0x1)
Info : JTAG tap: esp32.cpu1 tap/device found: 0x120034e5 (mfg: 0x272 (Tensilica), part: 0x2003, ver: 0x1)
JTAG tap: esp32.cpu0 tap/device found: 0x120034e5 (mfg: 0x272 (Tensilica), part: 0x2003, ver: 0x1)
JTAG tap: esp32.cpu1 tap/device found: 0x120034e5 (mfg: 0x272 (Tensilica), part: 0x2003, ver: 0x1)
Info : esp32.cpu0: Debug controller was reset.
Info : esp32.cpu0: Core was reset.
Info : esp32.cpu0: Target halted, PC=0x500000CF, debug_reason=00000000
esp32.cpu0: Debug controller was reset.
esp32.cpu0: Core was reset.
esp32.cpu0: Target halted, PC=0x500000CF, debug_reason=00000000
Info : esp32.cpu0: Core was reset.
esp32.cpu0: Core was reset.
Info : esp32.cpu0: Target halted, PC=0x40000400, debug_reason=00000000
Info : esp32.cpu1: Debug controller was reset.
Info : esp32.cpu1: Core was reset.
esp32.cpu0: Target halted, PC=0x40000400, debug_reason=00000000
esp32.cpu1: Debug controller was reset.
esp32.cpu1: Core was reset.
Info : esp32.cpu1: Target halted, PC=0x40000400, debug_reason=00000000
esp32.cpu1: Target halted, PC=0x40000400, debug_reason=00000000
Hardware assisted breakpoint 1 at 0x400d2154: file D:/yzhao/.platformio/packages/framework-arduinoespressif32/cores/esp32/main.cpp, line 56.
PlatformIO: Initialization completed
PlatformIO: Resume the execution to `debug_init_break = thb app_main`
PlatformIO: More configuration options -> https://bit.ly/pio-debug
Note: automatically using hardware breakpoints for read-only addresses.
Info : esp32.cpu1: Debug controller was reset.
esp32.cpu1: Debug controller was reset.
Info : esp32.cpu1: Core was reset.
esp32.cpu1: Core was reset.
Info : esp32.cpu1: Debug controller was reset.
Info : esp32.cpu1: Core was reset.
esp32.cpu1: Debug controller was reset.
esp32.cpu1: Core was reset.

message for stage02:

Info : esp32.cpu0: Target halted, PC=0x4000C02B, debu
g_reason=00000001
esp32.cpu0: Target halted, PC=0x4000C02B, debug_reason=00000001
Info : Set GDB target to 'esp32.cpu0'
Set GDB target to 'esp32.cpu0'
Warn : Unsupported syscall 3f40210c!
Unsupported syscall 3f40210c!
Info : esp32.cpu0: Target halted, PC=0x4000C02B, debug_reason=00000001
esp32.cpu0: Target halted, PC=0x4000C02B, debug_reason=00000001
Info : Set GDB target to 'esp32.cpu0'
Set GDB target to 'esp32.cpu0'
Warn : Unsupported syscall ffffffff!
Unsupported syscall ffffffff!
Info : esp32.cpu0: Target halted, PC=0x4000C02B, debug_reason=00000001
esp32.cpu0: Target halted, PC=0x4000C02B, debug_reason=00000001
Info : Set GDB target to 'esp32.cp
u0'
Set GDB target to 'esp32.cpu0'
Warn : Unsupported syscall ffffffff!
Unsupported syscall ffffffff!
Info : esp32.cpu0: Target halted, PC=0x4000C02B, debug_reason=00000001
Info : Set GDB target to 'esp32.cpu0'
esp32.cpu0: Target halted, PC=0x4000C02B, debug_reason=00000001
Set GDB target to 'esp32.cpu0'
Warn : Unsupported syscall ffffffff!
Unsupported syscall ffffffff!
Info : esp32.cpu0: Target halted, PC=0x4000C02B, debug_reason=00000001
Info : Set GDB target to 'esp32.cpu0'
esp32.cpu0: Target halted, PC=0x4000C02B, debug_reason=00000001
Set GDB target to 'esp32.cpu0'
Warn : Unsupported syscall ffffffff!
Unsupported syscall ffffffff!
Info : esp32.cpu0: Target halted, PC=0x4000C02B, debug_reason=00000001
esp32.cpu0: Target halted, PC=0x4000C02B, debug_reason=00000001
Info : Set GDB target to 'esp32.cpu0'
Set GDB target to 'esp32.cpu0'
Warn : Unsupported syscall ffffffff!
Unsupported syscall ffffffff!
Info : esp32.cpu0: Target halted, PC=0x4000C02B, debug_reason=00000001
esp32.cpu0: Target halted, PC=0x4000C02B, debug_reason=00000001
Info : Set GDB target to 'esp32.cpu0'
Set GDB target to 'esp32.cpu0'
Warn : Unsupported syscall ffffffff!
Unsupported syscall ffffffff!
Info : esp32.cpu0: Target halted, PC=0x4000C02B, debug_reason=00000001
Info : Set GDB target to 'esp32.cpu0'
esp32.cpu0: Target halted, PC=0x4000C02B, debug_reason=00000001
Set GDB target to 'esp32.cpu0'
Warn : Unsupported syscall ffffffff!
Unsupported syscall ffffffff!
Info : esp32.cpu0: Target halted, PC=0x4000C02B, debug_reason=00000001
esp32.cpu0: Target halted, PC=0x4000C02B, debug_reason=00000001
Info : Set GDB target to 'esp32.cpu0'
Set GDB target to 'esp32.cpu0'
Warn : Unsupported syscall ffffffff!
Unsupported syscall ffffffff!
Info : esp32.cpu0: Target halted, PC=0x4000C02B, debug_reason=00000001
esp32.cpu0: Target halted, PC=0x4000C02B, debug_reason=00000001
Info : Set GDB target to 'esp32.cpu0'
Set GDB target to 'esp32.cpu0'
Warn : Unsupported syscall ffffffff!
Unsupported syscall ffffffff!
Info : esp32.cpu0: Target halted, PC=0x4000C02B, debug_reason=00000001
Info : Set GDB target to 'esp32.cpu0'
esp32.cpu0: Target halted, PC=0x4000C02B, debug_reason=00000001
Set GDB target to 'esp32.cpu0'
Warn : Unsupported syscall ffffffff!
Unsupported syscall ffffffff!

message for stage03:

pio_reset_run_target
Cannot execute this command while the target is running.
Use the "interrupt" command to stop the target
and then try again.
Cannot execute this command while the target is running.
Use the "interrupt" command to stop the target
and then try again.
Cannot execute this command while the target is running.
Use the "interrupt" command to stop the target
and then try again.

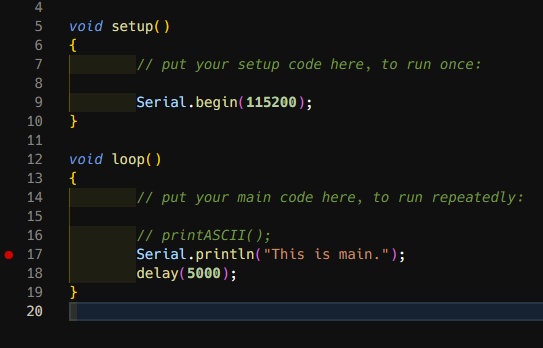
By the way, this is main.cpp:

image

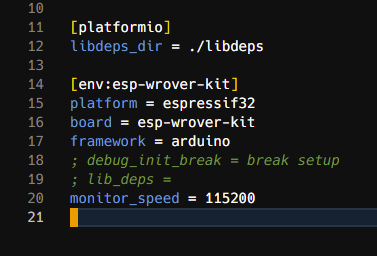
This is platformio.ini:

image

I’ve never seen that before, hm. A more familiar error is “DSR (FFFFFFFF) indicates DIR instruction generated an overrun” which always hinted at a bad cable connection or too high debug speed.

Try adding debug_speed = 500 (docs) into the platformio.ini and enable the debug_init_break line again, then use the regular “PIO Debug” target again. Does it change anything?

@maxgerhardt Thanks for your effort! Added debug_speed = 500, but stage02 from my last reply still occurs with almost the same error message:

Info : esp32.cpu0: Target halted, PC=0x4000C02B, debug_reason=00000001
esp32.cpu0: Target halted, PC=0x4000C02B, debug_reason=00000001
Info : Set GDB target to 'esp32.cpu0'
Set GDB target to 'esp32.cpu0'
Warn : Unsupported syscall 3f40210c!
Unsupported syscall 3f40210c!
Info : esp32.cpu0: Target halted, PC=0x4000C02B, debug_reason=00000001
esp32.cpu0: Target halted, PC=0x4000C02B, debug_reason=00000001
Info : Set GDB target to 'esp32.cpu0'
Set GDB target to 'esp32.cpu0'
Warn : Unsupported syscall ffffffff!
Unsupported syscall ffffffff!

Before this (stage01) message is:

Successfully created esp32 image.
========================= [SUCCESS] Took 15.03 seconds =========================
undefinedD:\yzhao\.platformio\packages\toolchain-xtensa-esp32\bin\xtensa-esp32-elf-gdb.exe: warning: Couldn't determine a path for the index cache directory.

Reading symbols from d:\workspace\embedded\ESP-WROVER-KIT\.pio\build\esp-wrover-kit\firmware.elf...
PlatformIO Unified Debugger -> https://bit.ly/pio-debug
PlatformIO: debug_tool = ftdi
PlatformIO: Initializing remote target...
Open On-Chip Debugger  v0.11.0-esp32-20220411 (2022-04-11-08:48)
Licensed under GNU GPL v2
For bug reports, read
	http://openocd.org/doc/doxygen/bugs.html
adapter speed: 20000 kHz

WARNING: boards/esp32-wrover.cfg is deprecated, and may be removed in a future release.
         If your board is ESP32-WROVER-KIT, use board/esp32-wrover-kit-1.8v.cfg instead.
DEPRECATED! use 'adapter speed' not 'adapter_khz'
adapter speed: 500 kHz

Info : tcl server disabled
Info : telnet server disabled
Info : clock speed 500 kHz
Info : JTAG tap: esp32.cpu0 tap/device found: 0x120034e5 (mfg: 0x272 (Tensilica), part: 0x2003, ver: 0x1)
Info : JTAG tap: esp32.cpu1 tap/device found: 0x120034e5 (mfg: 0x272 (Tensilica), part: 0x2003, ver: 0x1)
Info : esp32.cpu0: Debug controller was reset.
Info : esp32.cpu0: Core was reset.
Info : esp32.cpu1: Debug controller was reset.
Info : esp32.cpu1: Core was reset.
Info : starting gdb server for esp32.cpu0 on pipe
Info : accepting 'gdb' connection from pipe
Info : esp32.cpu0: Target halted, PC=0x400EC2EA, debug_reason=00000000
Info : Set GDB target to 'esp32.cpu0'
Info : esp32.cpu1: Target halted, PC=0x400EC2EA, debug_reason=00000000
Warn : No symbols for FreeRTOS!
Info : esp32.cpu0: Target halted, PC=0x4009260E, debug_reason=00000001
Info : Flash mapping 0: 0x10020 -> 0x3f400020, 47 KB
Info : Flash mapping 1: 0x20020 -> 0x400d0020, 115 KB
Info : esp32.cpu0: Target halted, PC=0x4009260E, debug_reason=00000001
Info : Auto-detected flash bank 'esp32.cpu0.flash' size 4096 KB
Info : Using flash bank 'esp32.cpu0.flash' size 4096 KB
Info : esp32.cpu0: Target halted, PC=0x4009260E, debug_reason=00000001
Info : Flash mapping 0: 0x10020 -> 0x3f400020, 47 KB
Info : Flash mapping 1: 0x20020 -> 0x400d0020, 115 KB
Info : Using flash bank 'esp32.cpu0.irom' size 116 KB
Info : esp32.cpu0: Target halted, PC=0x4009260E, debug_reason=00000001
Info : Flash mapping 0: 0x10020 -> 0x3f400020, 47 KB
Info : Flash mapping 1: 0x20020 -> 0x400d0020, 115 KB
Info : Using flash bank 'esp32.cpu0.drom' size 48 KB
Info : New GDB Connection: 1, Target esp32.cpu0, state: halted
Warn : negative reply, retrying
0x400ec2ea in esp_efuse_get_field_size (field=<optimized out>) at /home/runner/work/esp32-arduino-lib-builder/esp32-arduino-lib-builder/esp-idf/components/efuse/src/esp_efuse_api.c:167
167	/home/runner/work/esp32-arduino-lib-builder/esp32-arduino-lib-builder/esp-idf/components/efuse/src/esp_efuse_api.c: No such file or directory.
Loading section .dram0.data, size 0x354c lma 0x3ffbdb60
Loading section .iram0.vectors, size 0x403 lma 0x40080000
Loading section .iram0.text, size 0xd48f lma 0x40080404
Loading section .rtc.data, size 0x10 lma 0x50000200
Info : JTAG tap: esp32.cpu0 tap/device found: 0x120034e5 (mfg: 0x272 (Tensilica), part: 0x2003, ver: 0x1)
Info : JTAG tap: esp32.cpu1 tap/device found: 0x120034e5 (mfg: 0x272 (Tensilica), part: 0x2003, ver: 0x1)
Info : esp32.cpu0: Debug controller was reset.
Warn : keep_alive() was not invoked in the 1000 ms timelimit. GDB alive packet not sent! (1013 ms). Workaround: increase "set remotetimeout" in GDB
Info : esp32.cpu0: Core was reset.
Info : esp32.cpu0: Target halted, PC=0x500000CF, debug_reason=00000000
Info : esp32.cpu0: Core was reset.
Warn : keep_alive() was not invoked in the 1000 ms timelimit. GDB alive packet not sent! (1002 ms). Workaround: increase "set remotetimeout" in GDB
Info : esp32.cpu0: Target halted, PC=0x40000400, debug_reason=00000000
Info : esp32.cpu1: Debug controller was reset.
Info : esp32.cpu1: Core was reset.
Info : esp32.cpu1: Target halted, PC=0x40000400, debug_reason=00000000
Info : esp32.cpu0: Target halted, PC=0x4009260E, debug_reason=00000001
Info : JTAG tap: esp32.cpu0 tap/device found: 0x120034e5 (mfg: 0x272 (Tensilica), part: 0x2003, ver: 0x1)
Info : JTAG tap: esp32.cpu1 tap/device found: 0x120034e5 (mfg: 0x272 (Tensilica), part: 0x2003, ver: 0x1)
Info : esp32.cpu0: Debug controller was reset.
Warn : keep_alive() was not invoked in the 1000 ms timelimit. GDB alive packet not sent! (1010 ms). Workaround: increase "set remotetimeout" in GDB
Info : esp32.cpu0: Core was reset.
Info : esp32.cpu0: Target halted, PC=0x500000CF, debug_reason=00000000
Info : esp32.cpu0: Core was reset.
Info : esp32.cpu0: Target halted, PC=0x40000400, debug_reason=00000000
Info : esp32.cpu1: Debug controller was reset.
Info : esp32.cpu1: Core was reset.
Info : esp32.cpu1: Target halted, PC=0x40000400, debug_reason=00000000
Info : esp32.cpu0: Target halted, PC=0x4009260E, debug_reason=00000001
Loading section .flash.appdesc, size 0x100 lma 0x3f400020
Loading section .flash.rodata, size 0xbd14 lma 0x3f400120
Loading section .flash.text, size 0x1ce6b lma 0x400d0020
Info : Compressed 48660 bytes to 15405 bytes in 0.001007s
Info : PROF: Data transferred in 539.379 ms @ 27.8912 KB/s
Info : esp32.cpu0: Target halted, PC=0x4009260E, debug_reason=00000001
Info : Compressed 118379 bytes to 71097 bytes in 0.004763s
Info : PROF: Data transferred in 2490.5 ms @ 27.8781 KB/s
Info : esp32.cpu0: Target halted, PC=0x4009260E, debug_reason=00000001
Info : JTAG tap: esp32.cpu0 tap/device found: 0x120034e5 (mfg: 0x272 (Tensilica), part: 0x2003, ver: 0x1)
Info : JTAG tap: esp32.cpu1 tap/device found: 0x120034e5 (mfg: 0x272 (Tensilica), part: 0x2003, ver: 0x1)
Info : esp32.cpu0: Debug controller was reset.
Info : esp32.cpu0: Core was reset.
Info : esp32.cpu0: Target halted, PC=0x500000CF, debug_reason=00000000
Info : esp32.cpu0: Core was reset.
Info : esp32.cpu0: Target halted, PC=0x40000400, debug_reason=00000000
Info : esp32.cpu1: Debug controller was reset.
Info : esp32.cpu1: Core was reset.
Info : esp32.cpu1: Target halted, PC=0x40000400, debug_reason=00000000
Start address 0x400824f8, load size 236141
Transfer rate: 4 KB/sec, 12428 bytes/write.
Info : JTAG tap: esp32.cpu0 tap/device found: 0x120034e5 (mfg: 0x272 (Tensilica), part: 0x2003, ver: 0x1)
Info : JTAG tap: esp32.cpu1 tap/device found: 0x120034e5 (mfg: 0x272 (Tensilica), part: 0x2003, ver: 0x1)
JTAG tap: esp32.cpu0 tap/device found: 0x120034e5 (mfg: 0x272 (Tensilica), part: 0x2003, ver: 0x1)
JTAG tap: esp32.cpu1 tap/device found: 0x120034e5 (mfg: 0x272 (Tensilica), part: 0x2003, ver: 0x1)
Info : esp32.cpu0: Debug controller was reset.
Info : esp32.cpu0: Core was reset.
esp32.cpu0: Debug controller was reset.
esp32.cpu0: Core was reset.
Info : esp32.cpu0: Target halted, PC=0x500000CF, debug_reason=00000000
esp32.cpu0: Target halted, PC=0x500000CF, debug_reason=00000000
Info : esp32.cpu0: Core was reset.
esp32.cpu0: Core was reset.
Info : esp32.cpu0: Target halted, PC=0x40000400, debug_reason=00000000
Info : esp32.cpu1: Debug controller was reset.
Info : esp32.cpu1: Core was reset.
esp32.cpu0: Target halted, PC=0x40000400, debug_reason=00000000
esp32.cpu1: Debug controller was reset.
esp32.cpu1: Core was reset.
Info : esp32.cpu1: Target halted, PC=0x40000400, debug_reason=00000000
esp32.cpu1: Target halted, PC=0x40000400, debug_reason=00000000
Breakpoint 1 at 0x400d0f9f: file src/main.cpp, line 9.
PlatformIO: Initialization completed
PlatformIO: Resume the execution to `debug_init_break = break setup`
PlatformIO: More configuration options -> https://bit.ly/pio-debug
Note: automatically using hardware breakpoints for read-only addresses.
Info : esp32.cpu1: Debug controller was reset.
Info : esp32.cpu1: Core was reset.
esp32.cpu1: Debug controller was reset.
esp32.cpu1: Core was reset.
Info : esp32.cpu1: Debug controller was reset.
Info : esp32.cpu1: Core was reset.
esp32.cpu1: Debug controller was reset.
esp32.cpu1: Core was reset.

Hm interesting it’s different now.

Sadly I don’t have any further tips – please file an issue in Issues · platformio/platform-espressif32 · GitHub. If the error isn’t identifyable as being within PlatformIO, they might redirect you to GitHub - espressif/openocd-esp32: OpenOCD branch with ESP32 JTAG support though.

@maxgerhardt Thank you very much for your time.

Actually there’s no difference lol. You can see Unsupported syscall 3f40210c! in my previous reply as well.

I’m not pretty sure whether OpenOCD or Espressif should be responsible for this bug. Anyway I think platformio is doing a great job :smiley:

Hm well okay, but there was also this 0xffffff one

Start by filing an issue in platform-espressif32 as linked above, developers should take it from there.