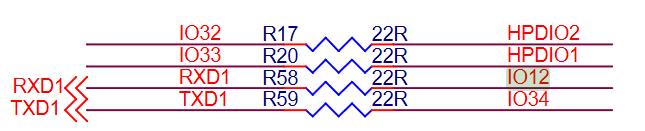
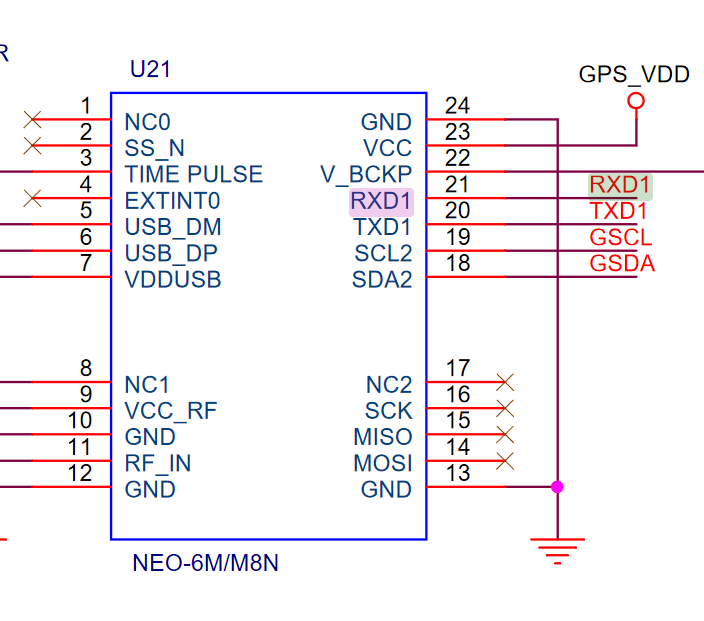
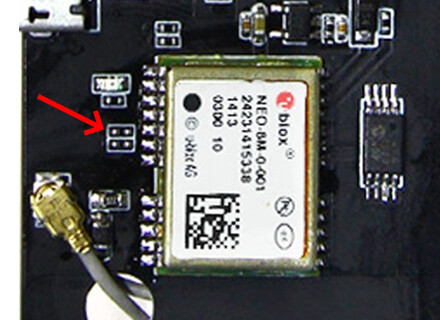
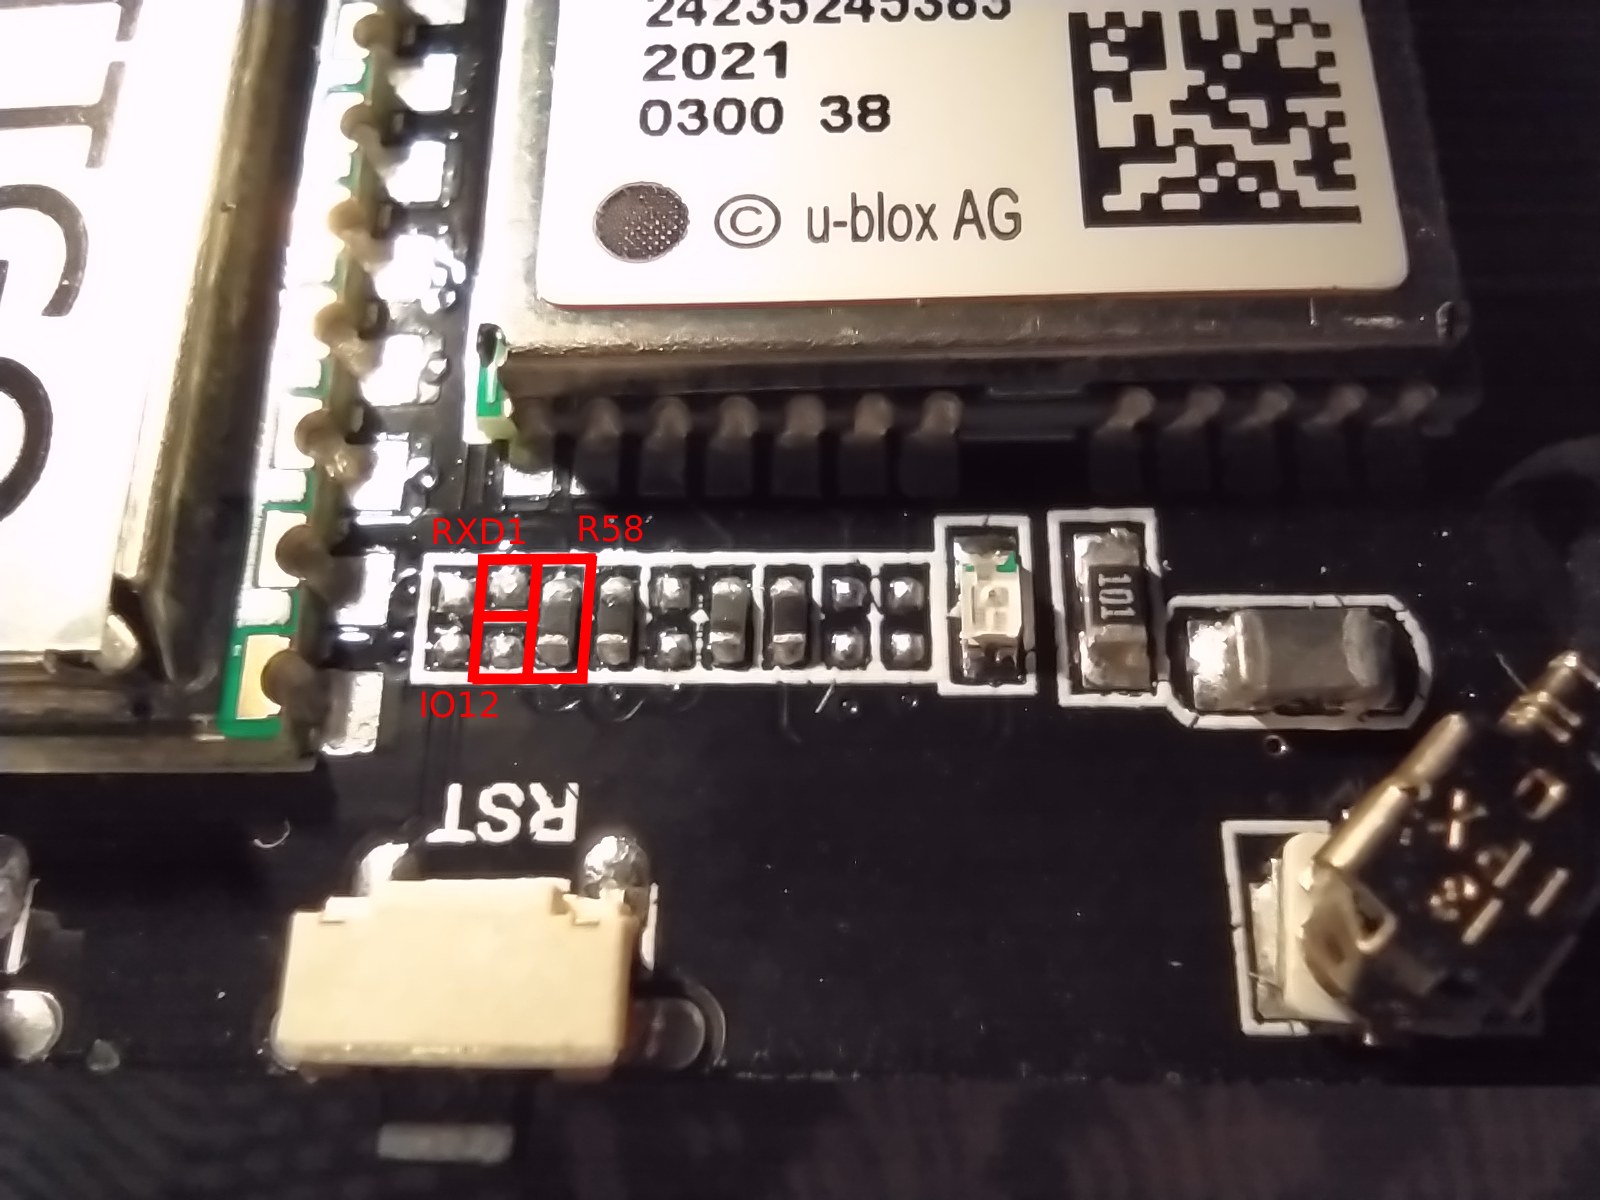
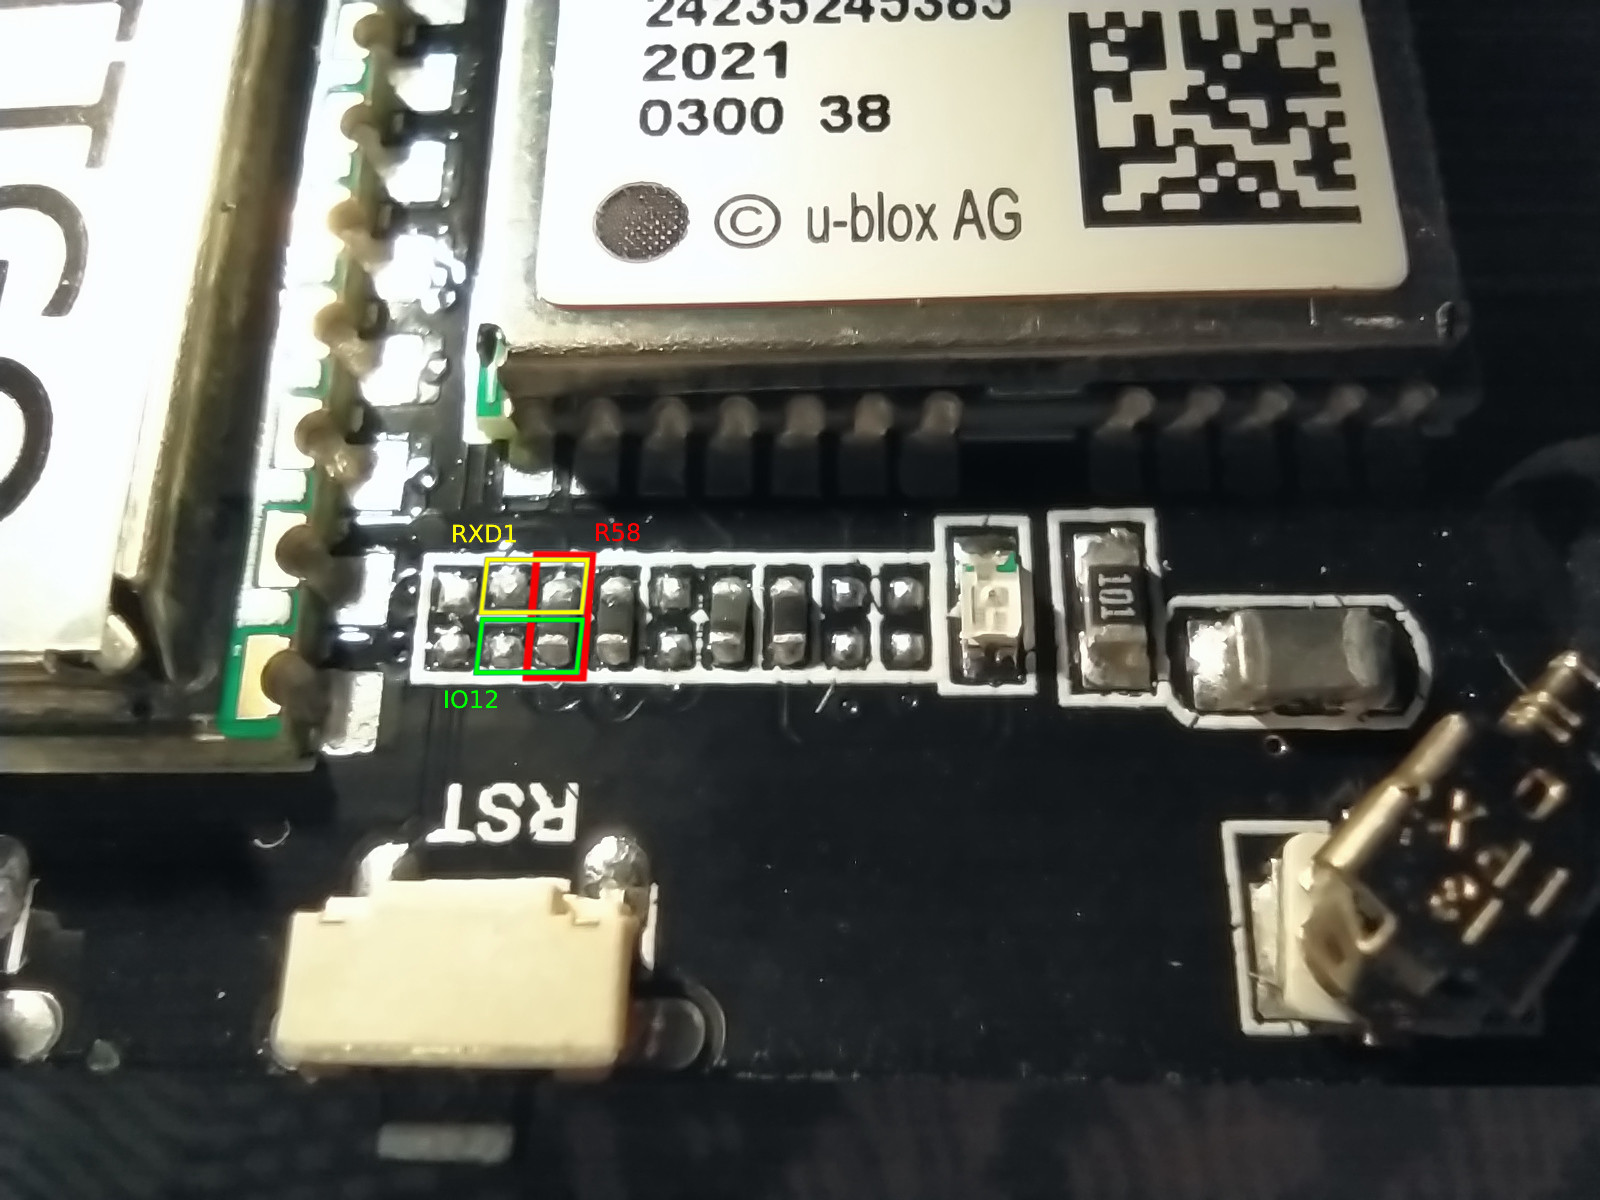
Well, I ended up soldering a cable in IO12 as shown in the picture without removing R58 and it seems that there are no shorts. However, I’m having some issues when I try to debug a simple “Hello World” script.
Processing ttgo-t-beam (platform: espressif32; board: ttgo-t-beam; framework: arduino)
--------------------------------------------------------------------------------
Verbose mode can be enabled via `-v, --verbose` option
CONFIGURATION: https://docs.platformio.org/page/boards/espressif32/ttgo-t-beam.html
PLATFORM: Espressif 32 (3.1.1) > TTGO T-Beam
HARDWARE: ESP32 240MHz, 1.25MB RAM, 4MB Flash
DEBUG: Current (esp-prog) External (esp-prog, iot-bus-jtag, jlink, minimodule, olimex-arm-usb-ocd, olimex-arm-usb-ocd-h, olimex-arm-usb-tiny-h, olimex-jtag-tiny, tumpa)
PACKAGES:
 - framework-arduinoespressif32 3.10005.210308 (1.0.5)
 - tool-esptoolpy 1.30000.201119 (3.0.0)
 - tool-openocd-esp32 2.1000.20201202 (10.0)
 - toolchain-xtensa32 2.50200.97 (5.2.0)
LDF: Library Dependency Finder -> http://bit.ly/configure-pio-ldf
LDF Modes: Finder ~ chain, Compatibility ~ soft
Found 28 compatible libraries
Scanning dependencies...
No dependencies
Building in debug mode
Compiling .pio/build/ttgo-t-beam/src/main.cpp.o
Generating partitions .pio/build/ttgo-t-beam/partitions.bin
Archiving .pio/build/ttgo-t-beam/libFrameworkArduinoVariant.a
Indexing .pio/build/ttgo-t-beam/libFrameworkArduinoVariant.a
Compiling .pio/build/ttgo-t-beam/FrameworkArduino/Esp.cpp.o
Compiling .pio/build/ttgo-t-beam/FrameworkArduino/FunctionalInterrupt.cpp.o
Compiling .pio/build/ttgo-t-beam/FrameworkArduino/HardwareSerial.cpp.o
Compiling .pio/build/ttgo-t-beam/FrameworkArduino/IPAddress.cpp.o
Compiling .pio/build/ttgo-t-beam/FrameworkArduino/IPv6Address.cpp.o
Compiling .pio/build/ttgo-t-beam/FrameworkArduino/MD5Builder.cpp.o
Compiling .pio/build/ttgo-t-beam/FrameworkArduino/Print.cpp.o
Compiling .pio/build/ttgo-t-beam/FrameworkArduino/Stream.cpp.o
Compiling .pio/build/ttgo-t-beam/FrameworkArduino/StreamString.cpp.o
Compiling .pio/build/ttgo-t-beam/FrameworkArduino/WMath.cpp.o
Compiling .pio/build/ttgo-t-beam/FrameworkArduino/WString.cpp.o
Compiling .pio/build/ttgo-t-beam/FrameworkArduino/base64.cpp.o
Compiling .pio/build/ttgo-t-beam/FrameworkArduino/cbuf.cpp.o
Compiling .pio/build/ttgo-t-beam/FrameworkArduino/esp32-hal-adc.c.o
Compiling .pio/build/ttgo-t-beam/FrameworkArduino/esp32-hal-bt.c.o
Compiling .pio/build/ttgo-t-beam/FrameworkArduino/esp32-hal-cpu.c.o
Compiling .pio/build/ttgo-t-beam/FrameworkArduino/esp32-hal-dac.c.o
Compiling .pio/build/ttgo-t-beam/FrameworkArduino/esp32-hal-gpio.c.o
Compiling .pio/build/ttgo-t-beam/FrameworkArduino/esp32-hal-i2c.c.o
Compiling .pio/build/ttgo-t-beam/FrameworkArduino/esp32-hal-ledc.c.o
Compiling .pio/build/ttgo-t-beam/FrameworkArduino/esp32-hal-log.c.o
Compiling .pio/build/ttgo-t-beam/FrameworkArduino/esp32-hal-matrix.c.o
Compiling .pio/build/ttgo-t-beam/FrameworkArduino/esp32-hal-misc.c.o
Compiling .pio/build/ttgo-t-beam/FrameworkArduino/esp32-hal-psram.c.o
Compiling .pio/build/ttgo-t-beam/FrameworkArduino/esp32-hal-rmt.c.o
Compiling .pio/build/ttgo-t-beam/FrameworkArduino/esp32-hal-sigmadelta.c.o
Compiling .pio/build/ttgo-t-beam/FrameworkArduino/esp32-hal-spi.c.o
Compiling .pio/build/ttgo-t-beam/FrameworkArduino/esp32-hal-time.c.o
Compiling .pio/build/ttgo-t-beam/FrameworkArduino/esp32-hal-timer.c.o
Compiling .pio/build/ttgo-t-beam/FrameworkArduino/esp32-hal-touch.c.o
Compiling .pio/build/ttgo-t-beam/FrameworkArduino/esp32-hal-uart.c.o
Compiling .pio/build/ttgo-t-beam/FrameworkArduino/libb64/cdecode.c.o
Compiling .pio/build/ttgo-t-beam/FrameworkArduino/libb64/cencode.c.o
Compiling .pio/build/ttgo-t-beam/FrameworkArduino/main.cpp.o
Compiling .pio/build/ttgo-t-beam/FrameworkArduino/stdlib_noniso.c.o
Compiling .pio/build/ttgo-t-beam/FrameworkArduino/wiring_pulse.c.o
Compiling .pio/build/ttgo-t-beam/FrameworkArduino/wiring_shift.c.o
Archiving .pio/build/ttgo-t-beam/libFrameworkArduino.a
Indexing .pio/build/ttgo-t-beam/libFrameworkArduino.a
Linking .pio/build/ttgo-t-beam/firmware.elf
Retrieving maximum program size .pio/build/ttgo-t-beam/firmware.elf
Checking size .pio/build/ttgo-t-beam/firmware.elf
Advanced Memory Usage is available via "PlatformIO Home > Project Inspect"
RAM:   [          ]   1.0% (used 13684 bytes from 1310720 bytes)
Flash: [==        ]  20.8% (used 272802 bytes from 1310720 bytes)
Building .pio/build/ttgo-t-beam/firmware.bin
esptool.py v3.0
========================= [SUCCESS] Took 13.80 seconds =========================
Reading symbols from /home/USER/Documents/PlatformIO/Projects/Simple/.pio/build/ttgo-t-beam/firmware.elf...
done.
PlatformIO Unified Debugger -> http://bit.ly/pio-debug
PlatformIO: debug_tool = esp-prog
PlatformIO: Initializing remote target...
Open On-Chip Debugger  v0.10.0-esp32-20201202 (2020-12-02-17:38)
Licensed under GNU GPL v2
For bug reports, read
	http://openocd.org/doc/doxygen/bugs.html
adapter speed: 20000 kHz

WARNING: boards/esp-wroom-32.cfg is deprecated, and may be removed in a future release.
Info : FreeRTOS creation
Info : FreeRTOS creation
adapter speed: 5000 kHz

Info : tcl server disabled
Info : telnet server disabled
Error: libusb_claim_interface() failed with LIBUSB_ERROR_BUSY
Error: unable to open ftdi device with vid 0403, pid 6010, description '*', serial '*' at bus location '*'
Error: no device found
Error: unable to open ftdi device with vid 0403, pid 6014, description '*', serial '*' at bus location '*'

openocd: ../src/jtag/core.c:343: jtag_checks: Assertion `jtag_trst == 0' failed.
Aborted (core dumped)
.pioinit:11: Error in sourced command file:
Remote communication error.  Target disconnected.: Connection reset by peer.
I tried to look on the internet for the last lines, but libusb_claim_interface() failed with LIBUSB_ERROR_BUSY doesn’t mean anything to me and I can’t think of a reason why it should be busy. I’ve tried to restart VSCode but nothing changes.
In addition, here’s the relevant output for lsusb
USER@HOST:~$ lsusb | grep UART
Bus 001 Device 023: ID 10c4:ea60 Cygnal Integrated Products, Inc. CP210x UART Bridge / myAVR mySmartUSB light
Bus 001 Device 026: ID 0403:6010 Future Technology Devices International, Ltd FT2232C Dual USB-UART/FIFO IC
Which makes the error unable to open ftdi device with vid 0403, pid 6014... make sense but not for the 6010. (Note that I downloaded and applied the udev rules some hours ago)
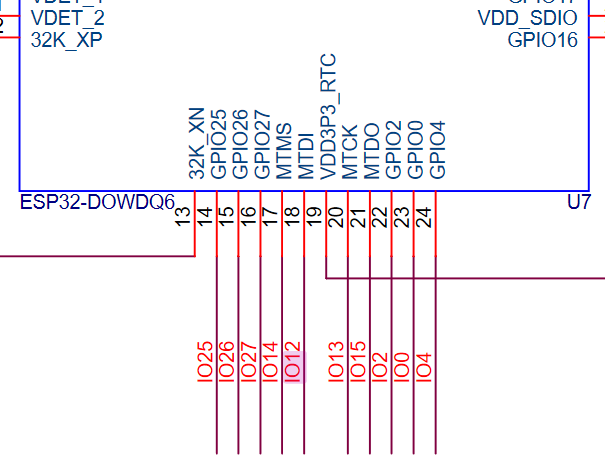
As for Assertion 'jtag_trst == 0' failed. I’ve found this SE post that mentions that I need to use the TRST pin if it exists, but I haven’t been able to fin it in the schematic. While at the same time the question mentions that this pin is optional.
I’m a little bit at loss and I’m not sure what’s actually wrong or what else should I check
