I have an ESP-Prog and an ESP32, and I want to debug a broken program.
The Prog is wired in to the ESP32.
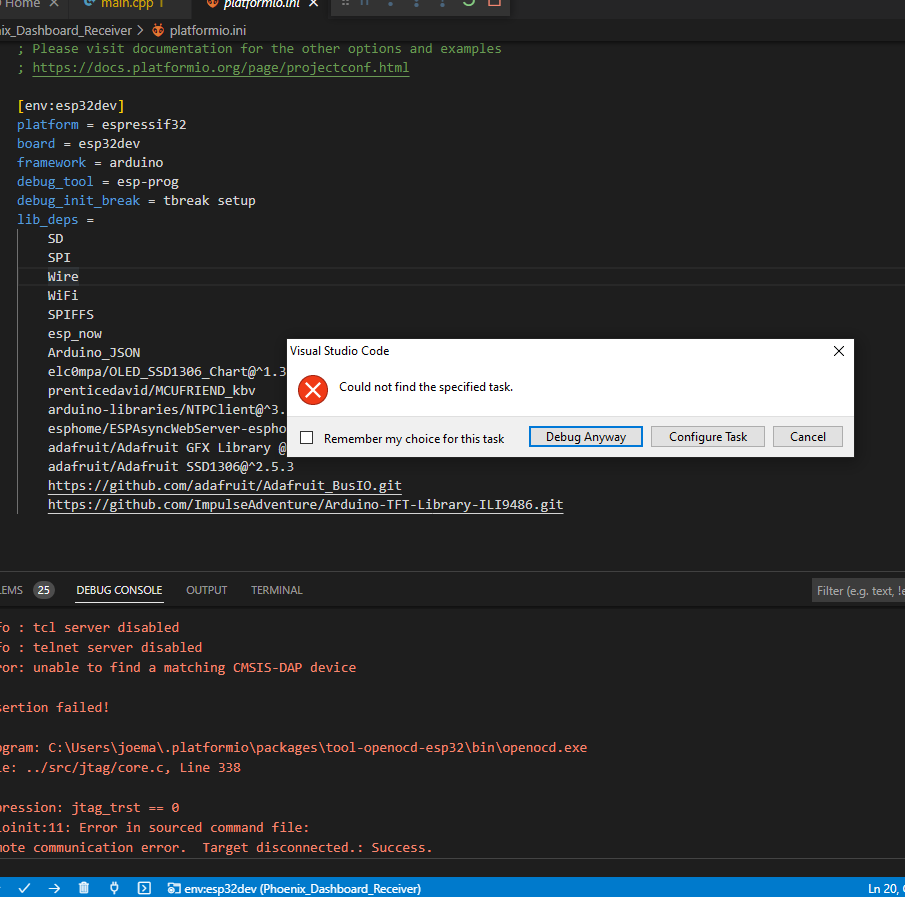
When I try to start debugging, I get this:
No debug task appears in the task list when I choose Configure.
.ini is set up for debug:
platform = espressif32

board = esp32dev

framework = arduino

debug_tool = esp-prog

debug_init_break = tbreak setup

lib_deps =

    SD...```
This is the debug console output:
undefinedC:\Users\joema.platformio\packages\toolchain-xtensa-esp32\bin\xtensa-esp32-elf-gdb.exe: warning: Couldn’t determine a path for the index cache directory.
Reading symbols from c:\Users\joema\Documents\PlatformIO\Projects\SPIFFS_Plot_Chart_32.pio\build\esp32dev\firmware.elf…
PlatformIO Unified Debugger → Redirecting...
PlatformIO: debug_tool = cmsis-dap
PlatformIO: Initializing remote target…
Open On-Chip Debugger v0.11.0-esp32-20220411 (2022-04-11-08:48)
Licensed under GNU GPL v2
For bug reports, read
OpenOCD: Bug Reporting
WARNING: boards/esp-wroom-32.cfg is deprecated, and may be removed in a future release.
DEPRECATED! use ‘adapter speed’ not ‘adapter_khz’
adapter speed: 5000 kHz
Info : tcl server disabled
Info : telnet server disabled
Error: unable to find a matching CMSIS-DAP device
Assertion failed!
Program: C:\Users\joema.platformio\packages\tool-openocd-esp32\bin\openocd.exe
File: …/src/jtag/core.c, Line 338
Expression: jtag_trst == 0
.pioinit:11: Error in sourced command file:
Remote communication error. Target disconnected.: Success.
That’s weird, why it would it look for a CMSIS-DAP device if you have debug_tool = esp-prog set – do you have multiple projects open?
I’ve engineered my habit so there’s only one program open when I’m working on it. If I’m cutting and pasting and making a mess, there can be several open. But not if I’m trying to learn debugging, for example.
I don’t know what any of that means. CMSIS?
What can I do about it?
I don’t know enough to tell if it’s working, but I can tell it isn’t working.
This line says its from a project called “SPIFFS_Plot_Chart_32”. Your screenshot shows you have the platformio.ini open from a project ending in “_Dashboard_Receiver”. That doesn’t match. Are you 100% sure you’re editing the platformio.ini of the opened project and you in the debug side pannel, you select the right “PIO Debug” target that has the project name in it?
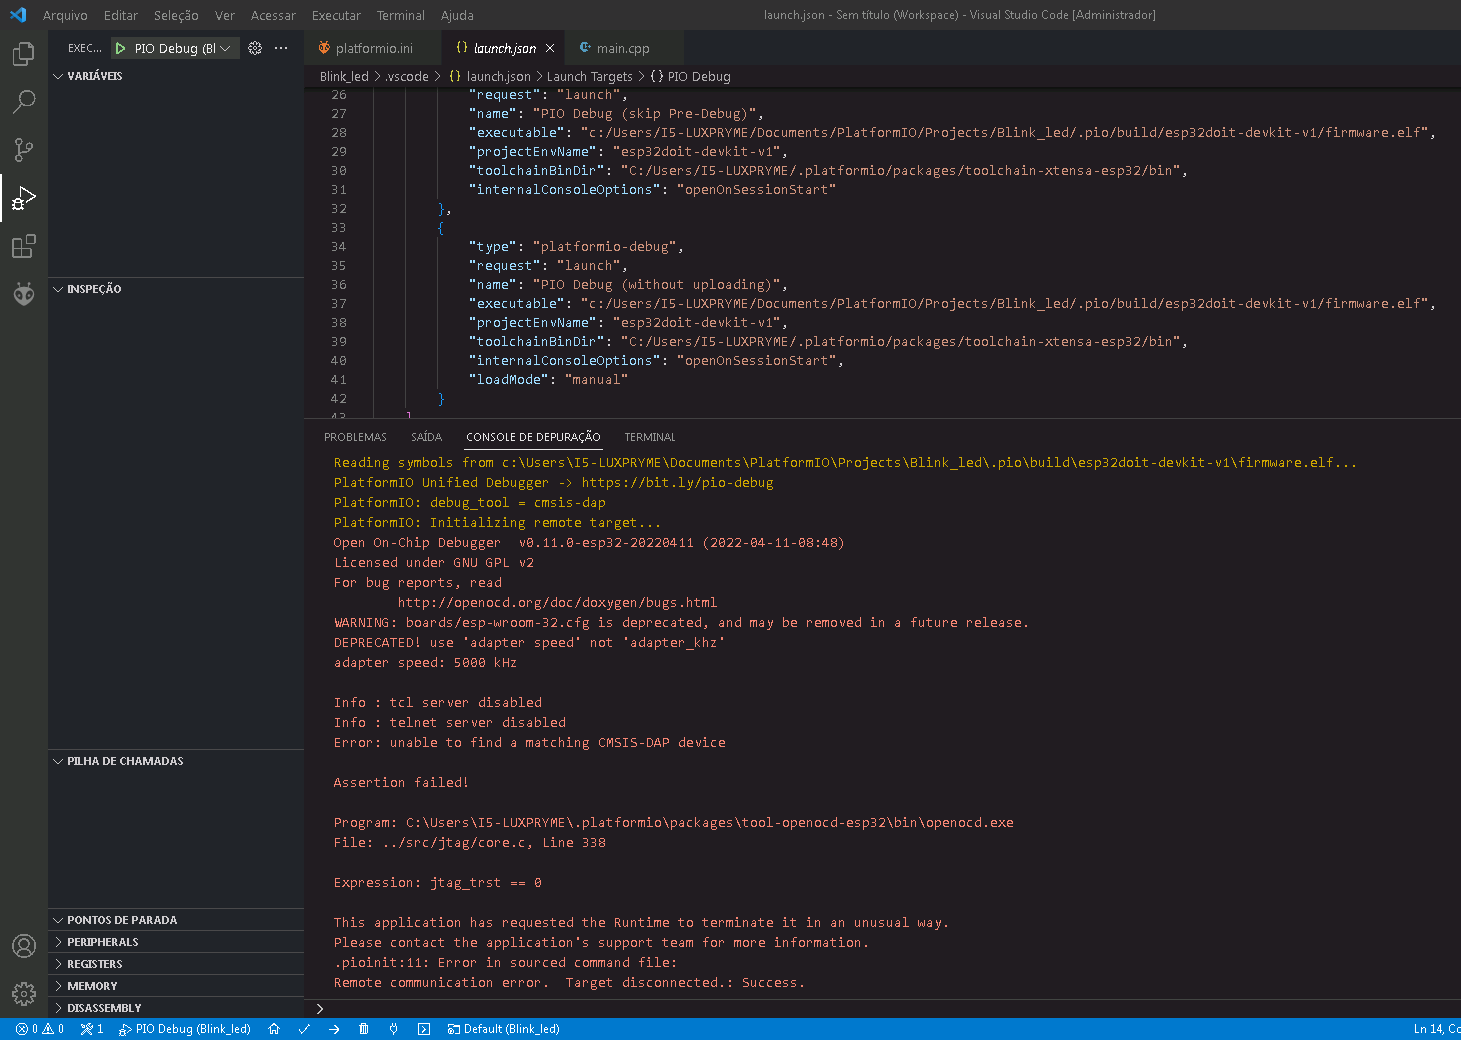
Hello,
I have a similar error, I’m using PlatformIO within VS Code for the first time and I’am load my led_blink, my code ran on the board without errors, but it generated this error when I try to debug it. I have only this project open.
The message seems to have something to do with this: ‘adapter speed’ not ‘adapter_khz’.
Could someone help me please?
Thank you.
Can you explicitly set
debug_tool = esp-prog
in the platformio.ini and see if the outupt changes?
What’s the content of the platformio.ini now?
I put it now:
[env:esp32doit-devkit-v1]
platform = espressif32
board = esp32doit-devkit-v1
framework = arduino
monitor_speed = 115200
debug_tool = esp-prog
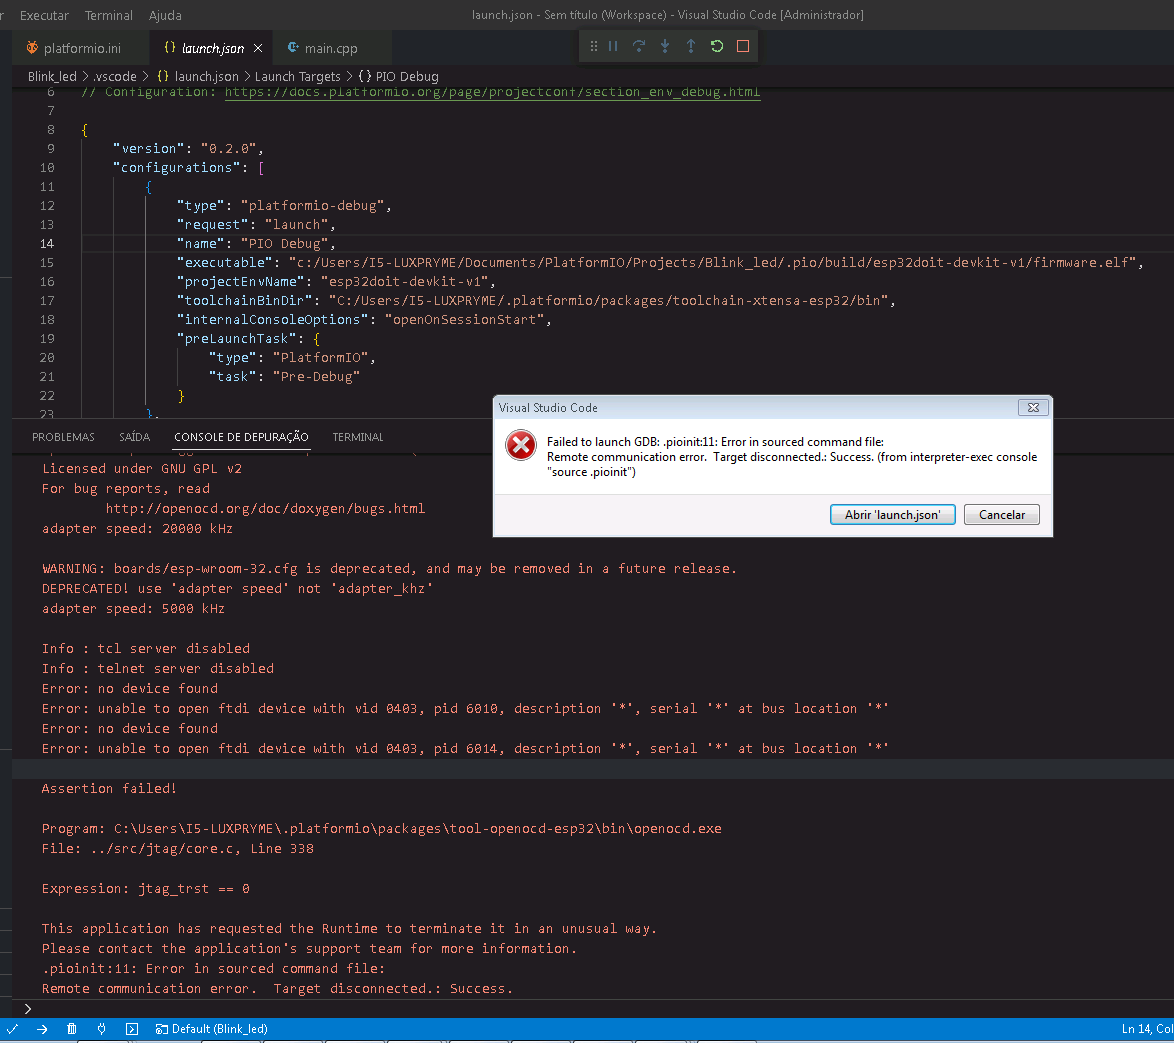
I modified as you said, but it generated a new error as shown in the photo:
It can’t find a connected ESP-Prog device.
Do you have an ESP-Prog device connected to the ESP32 via the JTAG cables like Low-cost ESP32 In-circuit Debugging | by Manuel Bl. | Medium shows? Without additional hardware, debugging the ESP32 is not possible in PlatformIO.
It’s all explained now.
I will buy one.
Thanks