Hi Community
Being new to this forum I’d like to briefly introduce myself. I am an electronics engineer by education and have been working in development before drifting more and more to management. Now I am retired, but still an engineer at heart. So I can finally realize all those little projects I had in my head but lacked the time to realize. ![]()
Some time ago I started to use the ESP32, first under the Arduino platform and Windows 10. I liked the huge choice of useful libraries, but found the IDE a little “simple”. Then I switched to Ubuntu and the ESP-IDF under eclipse. A great IDE, but I found espressif’s current development environment somewhat over-sophisticated. I.e. I didn’t quite get along with it - maybe I am just getting too old for that… ![]()
So when Andreas Spiess guided my attention to PlatformIO / VSC a few days ago I found all my dreams fulfilled: Arduino and ESP-IDF, an excellent IDE possibly even better than eclipse, running under Windows 10 and last but not least able to use GDB for inline-debugging.
So here I am: I want to start a GDB-session with my ESP-WROVER-KIT, of which the documentation says " Espressif ESP-WROVER-KIT has on-board debug probe and IS READY for debugging. You don’t need to use/buy external debug probe. " Compilation and uploading a little Arduino project was a breeze, but when I ran the command PlatformIO: Start Debugging , the debug console said this:
undefinedOpen On-Chip Debugger v0.10.0-esp32-20190708 (2019-07-08-11:04)
Licensed under GNU GPL v2
For bug reports, read
http://openocd.org/doc/doxygen/bugs.html
none separate
adapter speed: 15000 kHz
Info : Configured 2 cores
esp32 interrupt mask on
Info : Listening on port 6666 for tcl connections
Info : Listening on port 4444 for telnet connections
Error: libusb_open() failed with LIBUSB_ERROR_NOT_SUPPORTED
Error: libusb_open() failed with LIBUSB_ERROR_NOT_FOUND
Error: no device found
Error: unable to open ftdi device with vid 0403, pid 6010, description '*', serial '*' at bus location '*'
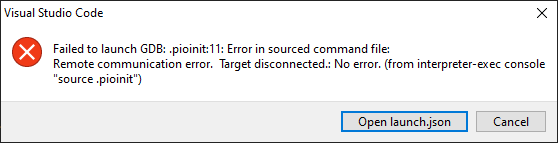
After a minute or so this message-box pops up: “Failed to launch GDB: Error in sourced command file:
Remote communication error. Target disconnected.: No error. (from interpreter-exec console “source .pioinit”)”
Line 11 of .pioinit reads target extended-remote COM5 Indeed COM5 is the JTAG debugging port of the ESP-WROVER-KIT.
This is the content of my platformio.ini:
[env:esp-wrover-kit]
platform = espressif32
board = esp-wrover-kit
framework = arduino
upload_port = COM6
upload_speed = 921000`
upload_protocol = esptool
monitor_speed = 115200
debug_tool = ftdi
debug_port = COM5
debug_init_break = tbreak setup
What did I do wrong? Can anybody help me as a newcomer, please?