Hi, I was using regular Arduino code and this is what I get there:
Guru Meditation Error: Core  0 panic'ed (LoadProhibited). Exception was unhandled.

Core  0 register dump:
PC      : 0x40084d1c  PS      : 0x00050031  A0      : 0x8008f89e  A1      : 0x3ffbe93c
A2      : 0x00000100  A3      : 0x00018100  A4      : 0x000637ff  A5      : 0x3ffbe91c
A6      : 0x00000000  A7      : 0x3ffbdc7c  A8      : 0x00000000  A9      : 0x00000000
A10     : 0x000001f4  A11     : 0x80000001  A12     : 0x800818e1  A13     : 0x3ffbe8fc
A14     : 0x3ffc3158  A15     : 0xfffffbff  SAR     : 0x0000001d  EXCCAUSE: 0x0000001c
EXCVADDR: 0x8008f8aa  LBEG    : 0x00000000  LEND    : 0x00000000  LCOUNT  : 0x00000000


Backtrace:0x40084d19:0x3ffbe93c |<-CORRUPTED
I read on the internet about your debug functionalities. I have set up PlatformIO with esp32-prog on vscode. My platformio.ini file looks like this:
[env:esp32dev]
platform = espressif32
board = esp32dev
framework = arduino
debug_tool = esp-prog
upload_protocol = esp-prog
monitor_filters = esp32_exception_decoder
build_type = debug
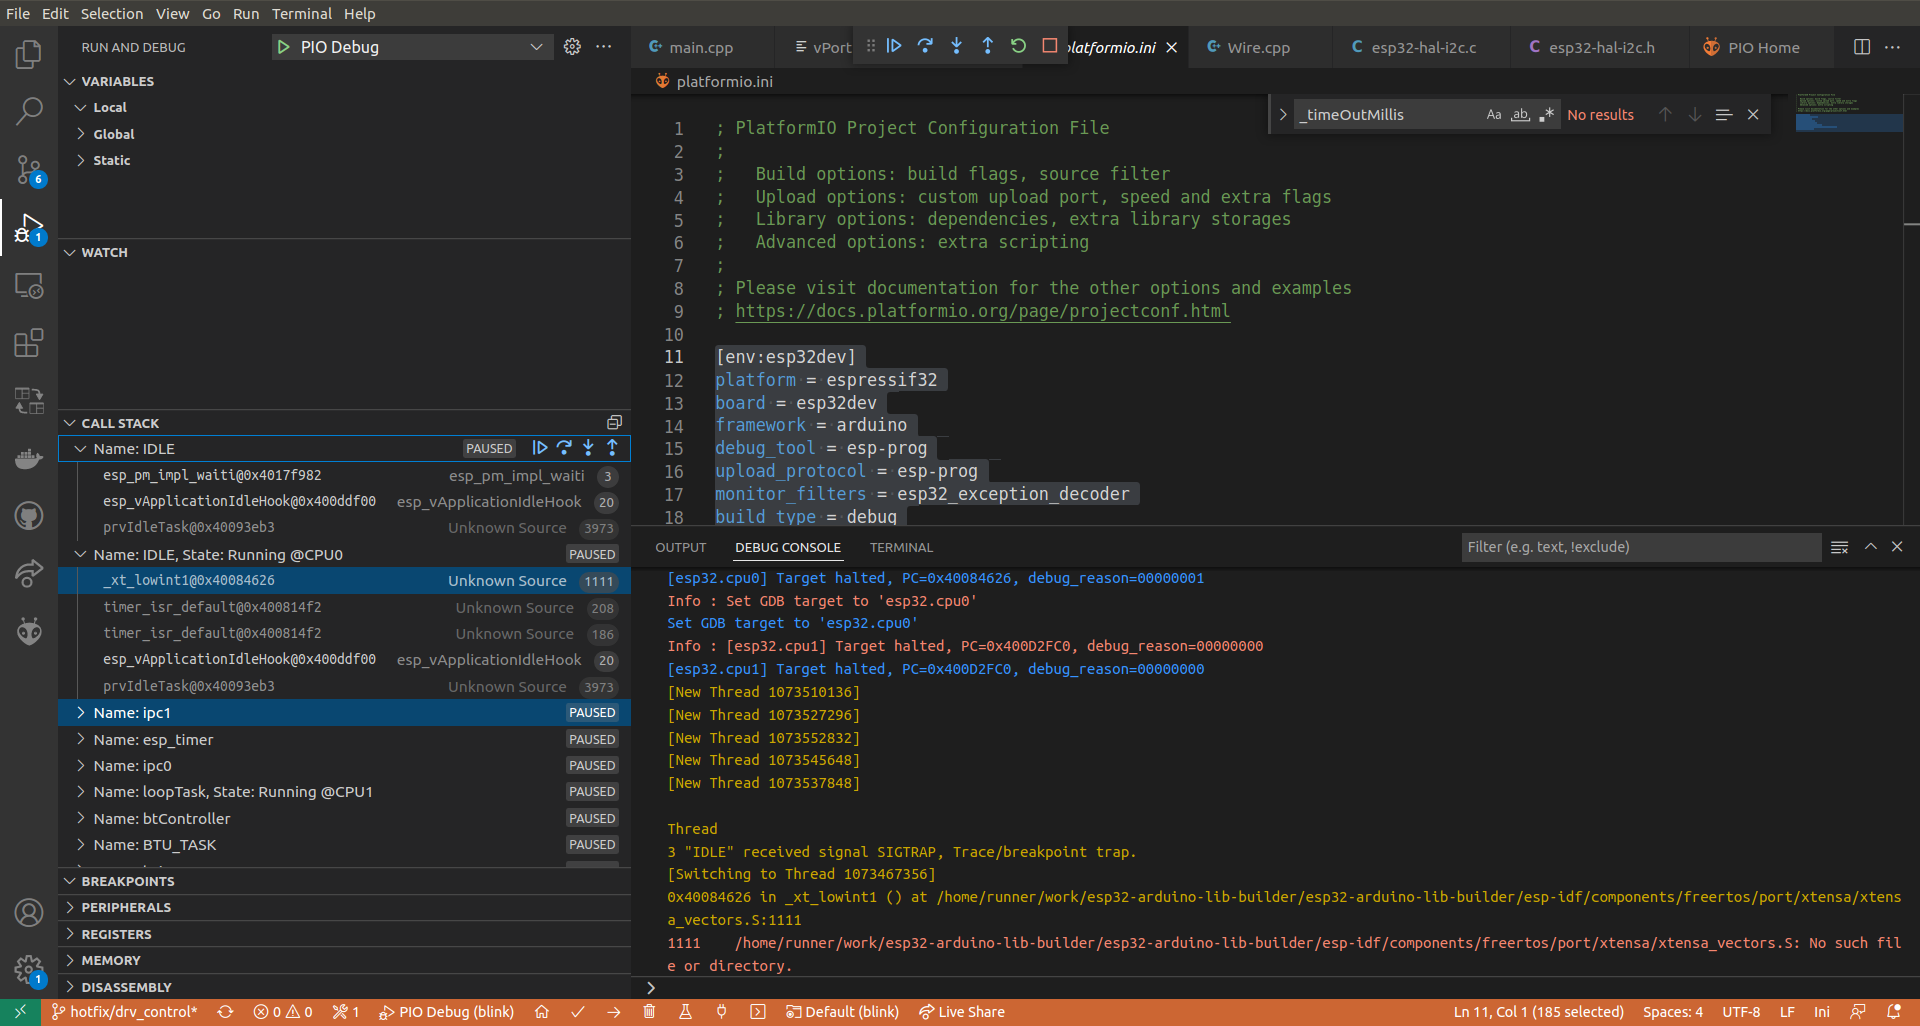
But I can hardly trace en error there. It just pauses execution and prints the following:
Thread
3 "IDLE" received signal SIGTRAP, Trace/breakpoint trap.
[Switching to Thread 1073467356]
0x40084626 in _xt_lowint1 () at /home/runner/work/esp32-arduino-lib-builder/esp32-arduino-lib-builder/esp-idf/components/freertos/port/xtensa/xtensa_vectors.S:1111
1111	/home/runner/work/esp32-arduino-lib-builder/esp32-arduino-lib-builder/esp-idf/components/freertos/port/xtensa/xtensa_vectors.S: No such file or directory.
Here is the image of vsCode:
Please help how I can try to debug it.