Strange sscanf behavior - Mbed + STM32F446

I am in 3-day fight with proper behavior of std functions such as vsscanf, sscanf.

My simplest code example:
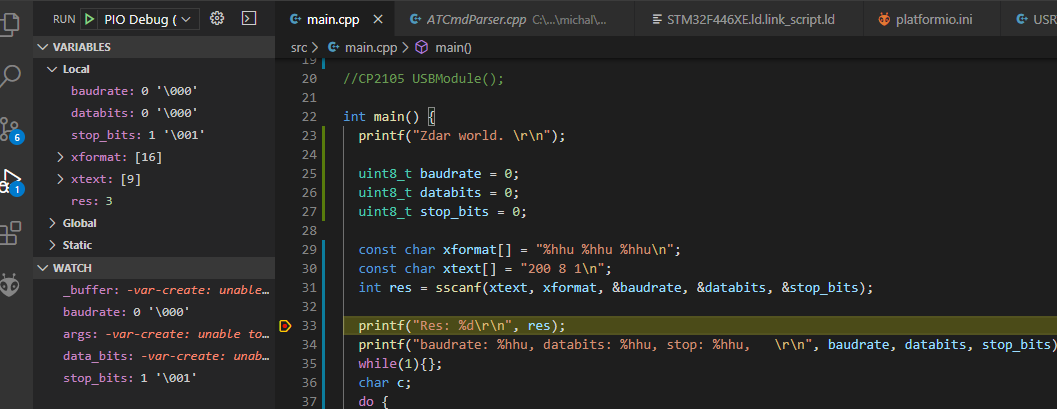
int main() {
uint8_t baudrate = 0;
uint8_t databits = 0;
uint8_t stop_bits = 0;

const char xformat[] = "%hhu %hhu %hhu\n";
const char xtext[] = "200 8 1\n";
int res = sscanf(xtext, xformat, &baudrate, &databits, &stop_bits);

printf("Res: %d\r\n", res);
printf("baudrate: %hhu, databits: %hhu, stop: %hhu,   \r\n", baudrate, databits, stop_bits);
while(1) {
}

}

In this setting, the output is:

Res: 3
baudrate: 0, databits: 0, stop: 1,

I have tried different datatypes, patterns and modifiers (%hhu for uint8_t, %lu for uint32_t etc.),
every setting has its flaws (e.g. some of the variables zero)
Even if the Res variable returns 3 every time.

What proved to be working is making the variables static, or to make all variable uint32_t or ints,
but these are not acceptable solutions.

I am asking, why the standard libraries are not working as they supposed to be ?

I have cross-checked the behavior with mbed online compiler, where it works as expected.
Using RTOS or no-RTOS mbed makes no difference in PlatformIO.

  • Visual Studio Code 1.43.2
  • PIO Core 4.3.1
  • PIO Home 3.1.1
  • ST-STM 6.0.0

You’re also printing an 8-bit variable like a 32-bit one, so it will probably corrupt your stack printf() pops too many bytes.

When you have memory corruption bugs like these, a part of the behavior is up to chance in the memory layout. Or there is different C/C++ standard library being used.

Anyways, following the guide from c - scanf can't scan into uint8_t - Stack Overflow using this code

#include <mbed.h>

int main() {
	uint8_t baudrate = 0;
	uint8_t databits = 0;
	uint8_t stop_bits = 0;

	const char xformat[] = "%hhu %hhu %hhu\n";
	const char xtext[] = "200 8 1\n";
	int res = sscanf(xtext, xformat, &baudrate, &databits, &stop_bits);

	printf("Res: %d\r\n", res);
	printf("baudrate: %hhu, databits: %hhu, stop: %hhu,   \r\n", baudrate, databits, stop_bits);
	while (1) {
	}
}

I get an output of

Res: 3
baudrate: 200, databits: 8, stop: 1,   

so no problems there.

As I have written in my question, I have tried %hhu in sscanf and printf too.
I am modifiing the question to exclude this kind of future advice.

I did no modification in memory layout.

I was unable to discover where are the standard libraries loaded from,
but the header files are located in:

.platformio\packages\toolchain-gccarmnoneeabi\arm-none-eabi\include\

Can you help me find the way, how to debug this kind of issue ?

Memory
STACK_SIZE = 4096;
MEMORY
{
  FLASH (rx) : ORIGIN = 0x08000000, LENGTH = 512K
  RAM (rwx) : ORIGIN = 0x200001C8, LENGTH = 128k - (0x1C4+0x4)
}
ENTRY(Reset_Handler)
SECTIONS
{
    .text :
    {
        KEEP(*(.isr_vector))
        *(.text*)
        KEEP(*(.init))
        KEEP(*(.fini))
        *crtbegin.o(.ctors)
        *crtbegin?.o(.ctors)
        *(EXCLUDE_FILE(*crtend?.o *crtend.o) .ctors)
        *(SORT(.ctors.*))
        *(.ctors)
        *crtbegin.o(.dtors)
        *crtbegin?.o(.dtors)
        *(EXCLUDE_FILE(*crtend?.o *crtend.o) .dtors)
        *(SORT(.dtors.*))
        *(.dtors)
        *(.rodata*)
        KEEP(*(.eh_frame*))
    } > FLASH
    .ARM.extab :
    {
        *(.ARM.extab* .gnu.linkonce.armextab.*)
    } > FLASH
    __exidx_start = .;
    .ARM.exidx :
    {
        *(.ARM.exidx* .gnu.linkonce.armexidx.*)
    } > FLASH
    __exidx_end = .;
    __etext = .;
    _sidata = .;
    .data : AT (__etext)
    {
        __data_start__ = .;
        _sdata = .;
        *(vtable)
        *(.data*)
        . = ALIGN(8);
        PROVIDE_HIDDEN (__preinit_array_start = .);
        KEEP(*(.preinit_array))
        PROVIDE_HIDDEN (__preinit_array_end = .);
        . = ALIGN(8);
        PROVIDE_HIDDEN (__init_array_start = .);
        KEEP(*(SORT(.init_array.*)))
        KEEP(*(.init_array))
        PROVIDE_HIDDEN (__init_array_end = .);
        . = ALIGN(8);
        PROVIDE_HIDDEN (__fini_array_start = .);
        KEEP(*(SORT(.fini_array.*)))
        KEEP(*(.fini_array))
        PROVIDE_HIDDEN (__fini_array_end = .);
        KEEP(*(.jcr*))
        . = ALIGN(8);
        __data_end__ = .;
        _edata = .;
    } > RAM
    .bss :
    {
        . = ALIGN(8);
        __bss_start__ = .;
        _sbss = .;
        *(.bss*)
        *(COMMON)
        . = ALIGN(8);
        __bss_end__ = .;
        _ebss = .;
    } > RAM
    .heap (COPY):
    {
        __end__ = .;
        end = __end__;
        *(.heap*)
        . = ORIGIN(RAM) + LENGTH(RAM) - STACK_SIZE;
        __HeapLimit = .;
    } > RAM
    .stack_dummy (COPY):
    {
        *(.stack*)
    } > RAM
    __StackTop = ORIGIN(RAM) + LENGTH(RAM);
    _estack = __StackTop;
    __StackLimit = __StackTop - STACK_SIZE;
    PROVIDE(__stack = __StackTop);
    ASSERT(__StackLimit >= __HeapLimit, "region RAM overflowed with stack")
}

Well, are you able to reproduce my results with the same output?

Still getting:

Res: 3
baudrate: 0, databits: 0, stop: 1,

I’m testing my code on a Nucleo F103RB with the platformio.ini

[env:nuc]
platform = ststm32
framework = mbed
board = nucleo_f103rb

and receive the correct output for that. Do you have any sepcial further configurations in your mbed_app.json or platformio.ini?

Idk about debugging the internal execution of the C/C++ library. Unless there is debug information for the libgcc.a file (which is btw located in toolchain-gccarmnoneeabi\lib\gcc\arm-none-eabi\7.2.1\thumb\v7-m\libgcc.a) something like this might be possible.

mbed_app.json:

{
“macros”: [
“MBED_TRACE_MAX_LEVEL=TRACE_LEVEL_DEBUG”,
“MBED_CONF_SPIF_DRIVER_DEBUG=1”,
“MBED_LFS_ENABLE_INFO=1”
],

"target_overrides": {
    "*": {
        "target.components_add": ["SPIF"],
        "target.features_add": ["STORAGE", "BOOTLOADER"]
    }
}

}

Platform.ini:

[env:nucleo_f446re]
platform = ststm32
board = nucleo_f446re
framework = mbed
;build_flags =
; -DPIO_FRAMEWORK_MBED_RTOS_PRESENT
build_type = debug

So when you use VSCode and the PIO plugin with the unified debugger, and put a breakpoint after the sscanf() has executed, do the variables have the correct content?

Unluckily I run on Win10 OS

No

When you hit the breakpoint after sscanf is executed, can you go in the debug console and type GDB commands?

Most interestingly the content of the stack and address of the variables with commands like

info frame
p &baudrate
p &databits
p &stop_bits
x/64xb $sp
1 Like

info frame

Stack level 0, frame at 0x2001fff8:
pc = 0x8004666 in main (src\main.cpp:33); saved pc = 0x80022ae
source language c++.
Arglist at 0x2001ffc8, args:
Locals at 0x2001ffc8, Previous frame’s sp is 0x2001fff8
Saved registers:

r4 at 0x2001fff0, lr at 0x2001fff4

p &baudrate

$4 = (uint8_t *) 0x2001ffef “”

p &databits

$5 = (uint8_t *) 0x2001ffee “”

p &stop_bits

$6 = (uint8_t *) 0x2001ffed “\001”

x/64xb $sp

0x2001ffc8: 0xed 0xff 0x01 0x20 0x31 0x08 0x00 0x08
0x2001ffd0: 0x32 0x30 0x30 0x20 0x38 0x20 0x31 0x0a
0x2001ffd8: 0x00 0x25 0x00 0x00 0x25 0x68 0x68 0x75
0x2001ffe0: 0x20 0x25 0x68 0x68 0x75 0x20 0x25 0x68
0x2001ffe8: 0x68 0x75 0x0a 0x00 0x93 0x01 0x00 0x00
0x2001fff0: 0x00 0x00 0x00 0x00 0xaf 0x22 0x00 0x08
0x2001fff8: 0x99 0x46 0x00 0x08 0x53 0x02 0x00 0x08
0x20020000: 0x00 0x00 0x00 0x00 0x00 0x00 0x00 0x00

is the memory content starting 0x2001ffed aka stop_bits. It seems as though from the stack that sscanf() has still interpreted every format identifier as 4-byte integers. Since stop_bits is the first variable in the stack memory but the last one that is read by the format identified, it seems possible that 0x0000001 (in little-endian) has been written as 32-bit word and overwrote all following variables (baudrate and databits).

You might even get different results if you exchange the declaration position of the baudrate and stop_bits variable in the code lol (fun thing to try).

I don’t see a problem with the invocation of sscanf and as I said it works perfectly fine with my F103RB so it might be a weird internal compiler / libc bug. A workaround would be to use local int variables instead of uint8_t when scanning and printing, and later casting or copying them to uint8_t.

You can also try forcing the usage of a different compiler. By adding the lines into the platformio.ini

; gcc 6.3.1 instead of 7.2.1
platform_packages =
    toolchain-gccarmnoneeabi@1.60301.0

or (1.80301.190214 for GCC 8.3.1, see https://dl.bintray.com/platformio/dl-packages/)

const char xtext = “1 8 200\n”;
int res = sscanf(xtext, xformat, &stop_bits, &databits, &baudrate);
gives
Res: 3
baudrate: 200, databits: 8, stop: 1,

const char xtext = “1 8 200\n”;
int res = sscanf(xtext, xformat, &baudrate, &databits, &stop_bits);
gives
Res: 3
baudrate: 0, databits: 0, stop: 200,

Very unpredictable.

Changing to 1.60301.0 provides no difference.

BUT, changing to 1.80301.190214 did finally helped.
You saved my day.
Thank you very much.

But after I unsimplify the example, there are still flaws.

uint32_t baudrate = 0;
uint8_t databits = 0;
uint8_t stop_bits = 0;

char parity_text[10];
char flowctrl_text[4];
const char xformat = “%lu,%hhu,%hhu,%[^,],%[^,]\n”;
const char xtext = “115200,8,1,EVEN,NFC\n”;
int res = sscanf(xtext, xformat, &baudrate, &databits, &stop_bits, (char*) &parity_text, (char*) &flowctrl_text);
printf(“Res: %d\r\n”, res);
printf(“baudrate: %lu, databits: %hhu, stop: %hhu, \r\n”, baudrate, databits, stop_bits);
printf(“parity: %s \r\n”, parity_text);
printf(“flowctrl: %s \r\n”, flowctrl_text);

Output:

Res: 5
baudrate: 115200, databits: 8, stop: 1,
parity:
flowctrl: NFC

So this time Parity is not parsed correctly. (Memory is: \0 V E N)

This was the first error before I started to simplify the code.

I will try on another machine, maybe this one is somehow cursed.

Sometimes, it is the only solution. :pensive:

Does that work in the mbed compiler? This may be a case of an embedded C/C++ library not supporting the entire width of the features like %[^,].

Also there’s toolchain version 1.90201.191206 for GCC 9.2.1 to try…

2 Likes

Yes, mbed compiler provides correct results.

1.90201.191206 provides no difference.

I very appreciate your help, but I think it’s time to give up now.

This might be due to the online compiler internally using the ARMCC toolchain and not the GNU GCC toolchain. Can can try to do a native mbed compilation (via mbed-cli) with also GCC as your toolchain. If it throws the same error the GLIBC is at fault.

Thank you again maxgerhardt.
The solution for the primary question was using toolchain-gccarmnoneeabi@1.90201.191206.

The second issue with parsing the strings is not related to the toolchain.
It was my mistake with char array length definition.
flowctrl_text[4] was not long enough to store NFC\n\0.
(The final \0 char has overwritten the other variable)