STM32L0: Radiolib + BME280 = infinite loop

Hello,

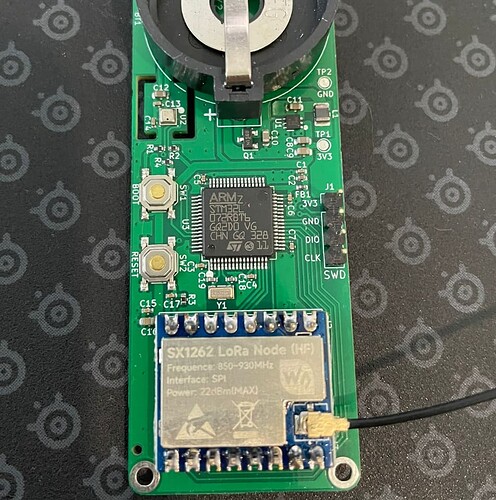
I’m encountering some issues with my custom board containing STM32L072RBT6 once again. I have tested two separate codebases. The first one reads on-board BME280 sensor values using the Adafruit BME280 library, and it works fine. The second code connects to LoRaWAN using my SX1262 module with the Radiolib library, and it also functions correctly. However, when I try to combine these two codes, I end up with an infinite loop.

Debugger does not stop on any breakpoint in any line in main.cpp file. It goes straight to Reset_Handler: / Infinite_Loop:. I get only this call stack and nothing much more to debug with.

WWDG_IRQHandler@0x0800c9bc (c:\Users\me\.platformio\packages\framework-arduinoststm32\system\Drivers\CMSIS\Device\ST\STM32L0xx\Source\Templates\gcc\startup_stm32l072xx.s:110)
<signal handler called>@0xfffffff9 (Unknown Source:0)
__libc_init_array@0x080113a4 (\__libc_init_array.dbgasm:5)
Reset_Handler@0x0800c99e (c:\Users\me\.platformio\packages\framework-arduinoststm32\system\Drivers\CMSIS\Device\ST\STM32L0xx\Source\Templates\gcc\startup_stm32l072xx.s:89)

I have only SWD port on board and using ST-LINK V2 (clone) for programming / debug using breakpoints.

Here is repository for the code I am testing with.

Thank you for your assistance.
The stacktrace shows it’s crashing inside the function that is supposed to call into all constructor functions. That is, the constructors of e.g. C++ objects like these two.

as well as

The C++ constructor execution order is not guaranteed. That creates problem with interdependent objects like radio and node. Further, if the constructor code of any such class access not-yet initialized objects, they might crash, too.

To avoid that you can make them just pointers and construct them dynamically in setup(), e.g.

SX1262* radio = nullptr;
LoRaWANNode* node = nullptr;
void setup() {
 //..
 Serial.println("Constructing radio..");
 Serial.flush();
 radio = new Module(PA4, PA0, PC4, PC5);

 Serial.println("Constructing node..");
 Serial.flush();
 node = new LoRaWANNode (radio, &Region, subBand);
 //..
}

you have to change the access to the variables from var.x to var->y too then though.

Thank you for your help. I made some updates to the best of my skills, and here is the updated code.

I’m still not able to get out of infinite loop but call stack has changed a bit

WWDG_IRQHandler@0x0800c9a0 (c:\Users\me\.platformio\packages\framework-arduinoststm32\system\Drivers\CMSIS\Device\ST\STM32L0xx\Source\Templates\gcc\startup_stm32l072xx.s:110)
<signal handler called>@0xfffffff9 (Unknown Source:0)
__aeabi_ddiv@0x0800ee02 (\__aeabi_ddiv.dbgasm:414)
??@0x00000000 (Unknown Source:0)

This does not tell much to me :sweat_smile:

I don’t see that behavior at all when I run this in the Renode emulator. It does reach main() and setup() for me just fine and does not crash in an a constructor.

Also suspicious that it has seemingly crashed in __aeabi_ddiv there, doing the software implementatinon of a divide (which the Cortex-M0+ CPU has no instruction for, so it has to do it in software).

When you add this into your main.cpp

extern "C" void HardFault_Handler() {
  while(1) {
    Serial.println("Crash!!\n");
  }
}

does the debugger end up in the hardfault handler?

Yes, I can see debugger landing in HardFault_Handler() after program starts from Reset_Handler: and I press pause

call stack:

HardFault_Handler@0x08005350 (c:\Users\me\Desktop\Node\radiolib-lorawan-example\src\main.cpp:3)
<signal handler called>@0xfffffff9 (Unknown Source:0)
__libc_init_array@0x0801138e (\__libc_init_array.dbgasm:6)
Reset_Handler@0x0800c986 (c:\Users\me\.platformio\packages\framework-arduinoststm32\system\Drivers\CMSIS\Device\ST\STM32L0xx\Source\Templates\gcc\startup_stm32l072xx.s:89)

Sadly this is extremely hard to debug. The Cortex M0+ has no register to indicate why exactly the hardfault occurred due to size constraints. Adding on top of that, a feature that would at least record the exact sequence of instructions that lead to the hardfault, the micro trace buffer, is also not implemented. for STM32L0. So this technique can’t be used, either.

In general, the Cortex-M0+ can easily be hard faulted if a load from an unaligned address is done, e.g., loading a uint16_t from an address that is not divisble by 2, or a uint32_t from an address not divisble by 4. Of course, other sources like executing invalid / undecodable instructions or jumping to execute-never memory sections, or jumping to an address that doesn’t have the last bit set to 1 (for thumb vs arm mode, CM0+ only does Thumb mode) are possible, too.

Since that hardfault is not reproducable for me in Renode, it could either be something very temperamental like the compiler sometimes generating wrong code or placing variables in address that lead to unaligned access, or Renode simply doesn’t emulate the Cortex-M0+ correctly enough.

The only thing I can recommend are:

  • go back to the examples that were working and make sure they are still working when flashes. If not, the microcontroller or toolchain or framework files or whatever might have become damaged
  • start commenting out application code until the firmware boots up properly. Then, find out what exact line when uncommented makes it crash again
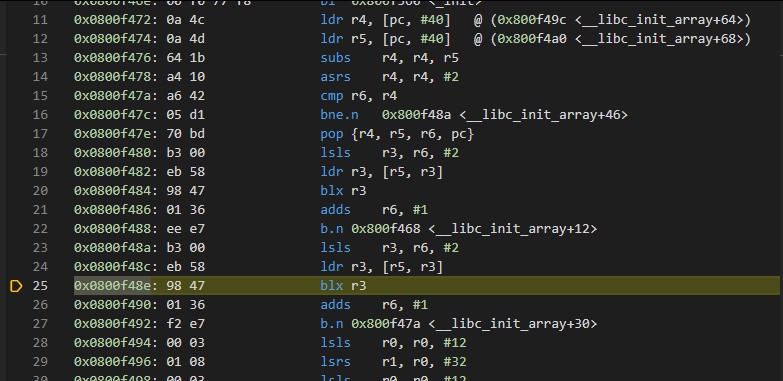
  • set debug_init_break = b __libc_init_array in the platformio.ini to halt the debugger in that critical function. That function itself just calls function pointers from two arrays with the init() function in between (source). The disassembly should look in parts something like this

Set a breakpoint at every line that does a jump to an address contained in a register, i.e. blx r3 in line 20 and 25 in this example, with GDB commands like b *0x0800f48e in the ‘Debug Console’. Make it continue (c) and inspect the register’s value that it wants to jump to (i r r3) and verify the address is odd (ending with hex 1,3,5,7,9,b,d,f) and not 0x00000000. Use stepi to step into the function pointer execution, this should show you what constructor or function is being called (where command). finish function execution of the constructor code if needed. You can use this to hopefully trace the execution into the exact code that crashes.

1 Like

Thank you for this really comprehensive answer. I will try to dig deeper with the methods you provided :clap:

I noticed that if I only comment out node->activateOTAA(); then the code/breakpoints works (but it is unable to join LoRaWAN, of course).

Edit: And this time call stack looks following

HardFault_Handler@0x08005350 (c:\Users\me\Desktop\Node\radiolib-lorawan-example\src\main.cpp:3)
<signal handler called>@0xfffffff9 (Unknown Source:0)
SPIClass::beginTransaction@0x0801059c (c:\Users\me\.platformio\packages\framework-arduinoststm32\libraries\SPI\src\SPI.cpp:75)
??@0x00000000 (Unknown Source:0)

Good day,

I spent some time trying to narrow down the exact line that causes this issue. I noticed that when I comment out Wire.begin();, the LoRa functionality works.

#include <Wire.h>
#include "config.h"

float temperature, pressure, humidity;

SX1262 *radio = nullptr;
LoRaWANNode *node = nullptr;

void setup()
{
  // Wire.begin();

  radio = new SX1262(new Module(PA4, PA0, PC4, PC5));

  node = new LoRaWANNode(radio, &Region, subBand);

  radio->begin();
  radio->setRfSwitchPins(PA3, PA2);

  node->beginOTAA(joinEUI, devEUI, nwkKey, appKey);
  node->activateOTAA();
}

void loop()
{
  delay(500);
}

void cleanup()
{
  delete node;
  delete radio;
}

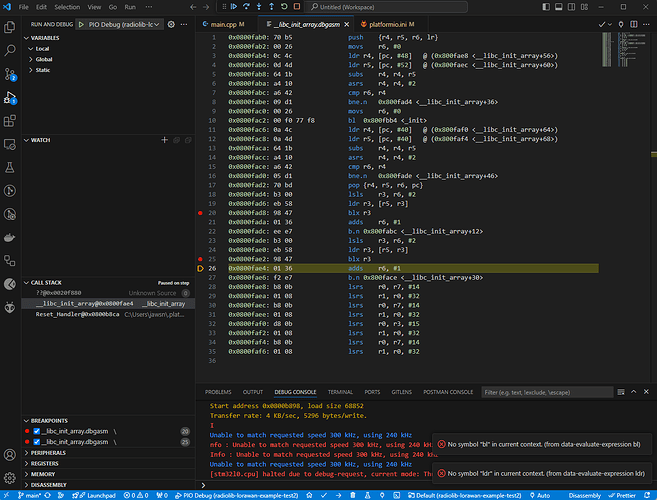
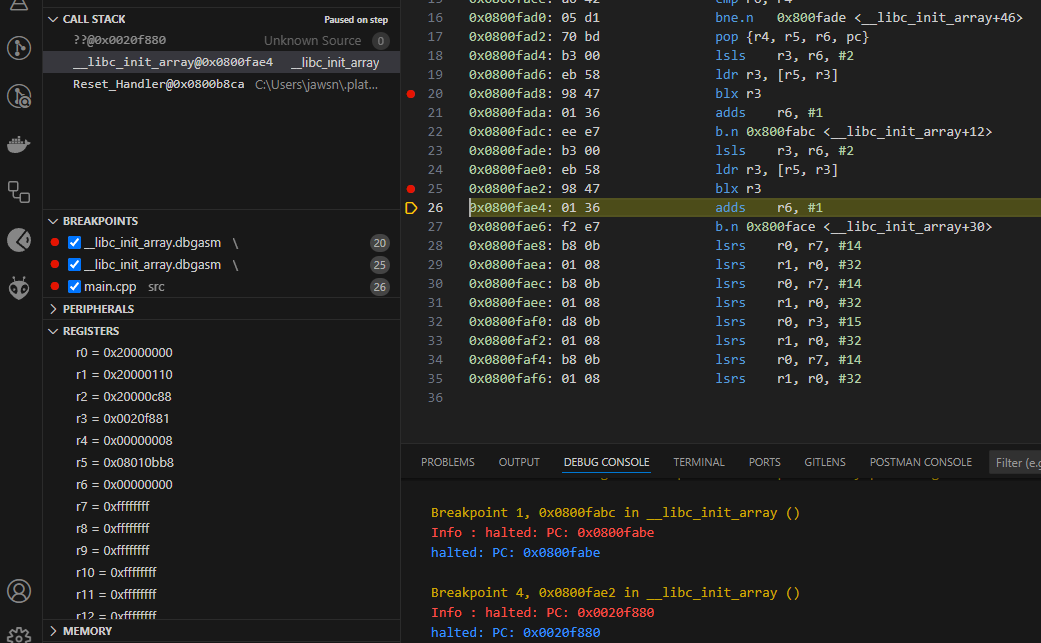
Then, when uncommenting Wire.begin();, I’m able to see the disassembly as you showcased. I put breakpoints at lines 20 and 25. The breakpoint at line 20 is not triggered, but the one at line 25 is. When I then click “Step into,” it goes to line 26, but after that, if I try to click “Step into” again or “Step over,” I get the following error popping up in VS Code:

Could not step over: TypeError: Cannot read properties of null (reading ‘name’)

call stack when Wire.begin(); is uncommented (infinite loop) looks following:

WWDG_IRQHandler@0x0800b8e8 (c:\Users\me\.platformio\packages\framework-arduinoststm32\system\Drivers\CMSIS\Device\ST\STM32L0xx\Source\Templates\gcc\startup_stm32l072xx.s:110)
<signal handler called>@0xfffffff9 (Unknown Source:0)
??@0x0020f880 (Unknown Source:0)
__libc_init_array@0x0800fae4 (\__libc_init_array.dbgasm:26)
Reset_Handler@0x0800b8ca (c:\Users\me\.platformio\packages\framework-arduinoststm32\system\Drivers\CMSIS\Device\ST\STM32L0xx\Source\Templates\gcc\startup_stm32l072xx.s:89)

I am not completely sure what address I have to verify from the picture to end with odd value :thinking:

Expand the “Registers” section in the bottom left corner of the debugger. When the breakpoint is hit at the blx r3 instruction, verify the contents of r3. Then, use stepi or Step into to follow program execution into the execution of that function pointer.

Additionally, all these addresses should be either in Flash (about 0x08000000) or SRAM for fancy RAM functions (0x20000000).

That here indicates that it somehow tried to jump to address 0x0020f880 which is neither in Flash nor in RAM. It’s a garbage address.

Find out how it ended up there. Whether it was gotten as the address for r3 (and thus in that libc preinit function pointers array) or whether some other code caused a jump there.

Okay so I checked the r3 address which seems to be 0x0020f881. It differs by 1 from the call stack value

??@0x0020f880 (Unknown Source:0)

Additionally when I try to “Step into” from that breakpoint it puts me on next line but from there “Step into” does not work anymore

That’s fine because the actual address jumped to will always have the last bit set to 0, but th original address’s last bit determines whether it will jump there in thumb mode (last bit 1) or ARM mode (last bit 0). So jump to 0x0020f881 will jump to 0x0020f881 in Thumb processor mode, which is fine. Your chip only supports Thumb mode.

The more interesting question is why is it pulled that value. Technically you’re looking at the execution state after the blx r3 jump, so r3 could have already been overwritten by another program. maybe you need to set the breakpoint one line higher for it to hit blx r3 correctly.

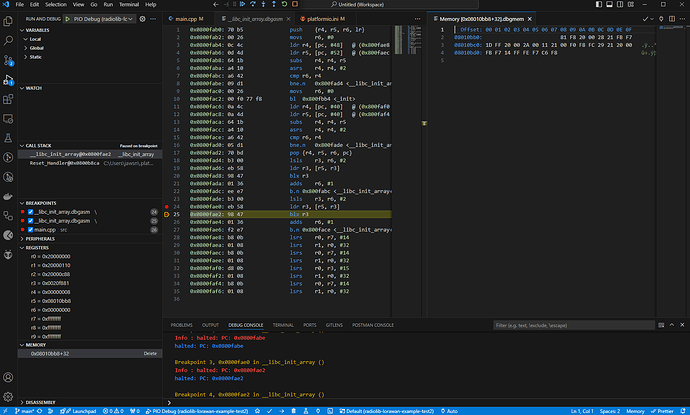
Looking at the disassembly it seems the memory address for the libc_init table is

0x08010bb8 to 0x08010bd8

aka eight 32-bit pointers. Can you dump the values for those with

x/32x *0x08010bb8
or
x/32x 0x08010bb8

?

Does this look correct?

  Offset: 00 01 02 03 04 05 06 07 08 09 0A 0B 0C 0D 0E 0F 	
08010bb0:                         81 F8 20 00 28 21 FB F7           .ø..(!û÷
08010bc0: 1D FF 20 00 2A 00 11 21 00 F0 F8 FC 29 21 20 00   .ÿ..*..!.ðøü)!..
08010bd0: FB F7 14 FF FE F7 C6 F8                           û÷.ÿþ÷Æø

Okay that’s completely trashed. It very clearly loaded the value 0x0020F881 into R3 from the table of init functions. That memory address is BS. It’s not in Flash, it’s not in RAM. The compiler should have not put it there.

Can you push this exact current state to the Github along with a copy of your .pio\build\savi\firmware.elf?

Updated now :+1: .elf is here

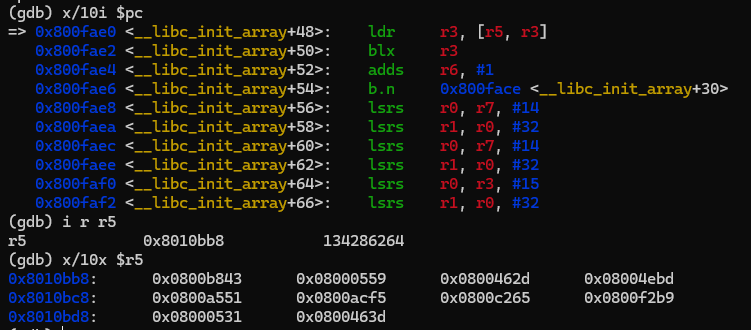
Either I’m going crazy or your chip is cursed. For me, when I run in the Renode emulator, I see the contents of the preinit table as completely different, all being nice Flash addresses.

Specifically the first loaded address should be 0x0800fae2 which is the premain() function of the Arduino core. Good.

Printing the start address of the array and printing its values shows the same. Good function pointers.

Something really really funky is going on if it can’t read the contents of the flash memory anymore. Maybe something screwed the flash or CPU frequency seetings or WAIT states, that makes it make return wrong content, or your chip actually has less flash than it says.

  1. Can you read the exact markings of the chip again?
  2. Do you have a crystal oscilllator on the board? Of what frequency?

Ok not sure if these are good news or not but at least the board is not completely bricked :sweat_smile:

Processor should be genuine STM32L072RBT6

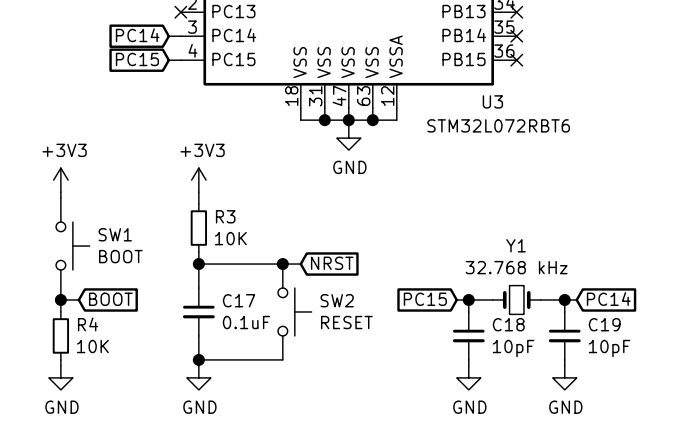
Also there should be 32.768 kHz crystal oscillator on board according to schematics. It’s placed between MCU and LoRa module with symbol Y1

image

Okay the module and hardware look good.

Set debug_init_break = b Reset_Handler so that it breaks at the very first instruction. Then execute

p (uint32_t*[20])__preinit_array_start

and

p (uint32_t*[20])__init_array_start

What does it output?

p (uint32_t*[20])__preinit_array_start output

$1 = {0x20f881, 0xf7fb2128, 0x20ff1d, 0x2111002a, 0xfcf8f000, 0x202129, 0xff14f7fb, 0xf8c6f7fe, 0x202111, 0xf00068d2, 0x23a4fced, 0x58e3005b, 0xd0032b00, 0x9a042388, 0x50e2005b, 0x5b2382, 0x2b3c5ce3, 0xf000d101, 0x2380fbfb, 0x58e3005b}

{"token":20,"outOfBandRecord":[],"resultRecords":{"resultClass":"done","results":[]}}

p (uint32_t*[20])__init_array_start output

$2 = {0x20f881, 0xf7fb2128, 0x20ff1d, 0x2111002a, 0xfcf8f000, 0x202129, 0xff14f7fb, 0xf8c6f7fe, 0x202111, 0xf00068d2, 0x23a4fced, 0x58e3005b, 0xd0032b00, 0x9a042388, 0x50e2005b, 0x5b2382, 0x2b3c5ce3, 0xf000d101, 0x2380fbfb, 0x58e3005b}

{"token":22,"outOfBandRecord":[],"resultRecords":{"resultClass":"done","results":[]}}

Then the entire array is filled with garbage values. It should look like this.

I’m not sure at this point if the firmware gets uploaded correctly into the flash memory. Can you use https://www.st.com/en/development-tools/stm32cubeprog.html to do a flash mass erase once, then try to debug again?