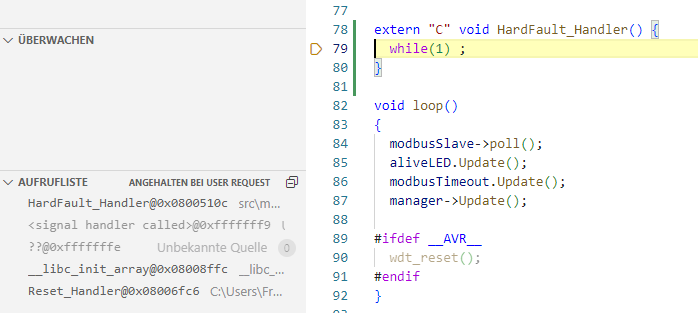
When I want to debug the software, PIO build and uploads them with the embedded JLink debugger successfully. But the software runs not as expected. When I hit “pause” I see that the program hangs in “Infinite_Loop” in the startup_stm32l432xx.s.
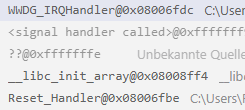
Call stack:
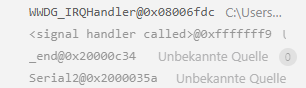
When I reset the controller with the onboard reset button the call stack looks like this:
The first strange thing is, when I remove 2 function from my software (which will be not called when the controller starts up) debugging works. → memory problem?
When I build the software for the STM32 without debugging capabilities, the software works also as expected.
I don’t have the deep knowledge how to solve this issue but it would be nice to know more about this.
The fact that __libc_init_array() is in the callstack heavily suggests that it’s crashing in the constructor code of an object you create (or have written yourself).
So what is the code for these two functions? Must both be removed for the startup to work?
The fact that __libc_init_array() is in the callstack heavily suggests that it’s crashing in the constructor code of an object you create (or have written yourself).
Ok. But why does the software work when I only upload (without a debugging session)?
The two functions which I commented out are functions within a member function of a class. These two functions are not called while starting up phase of the controller.
And yes I must comment out both functions.
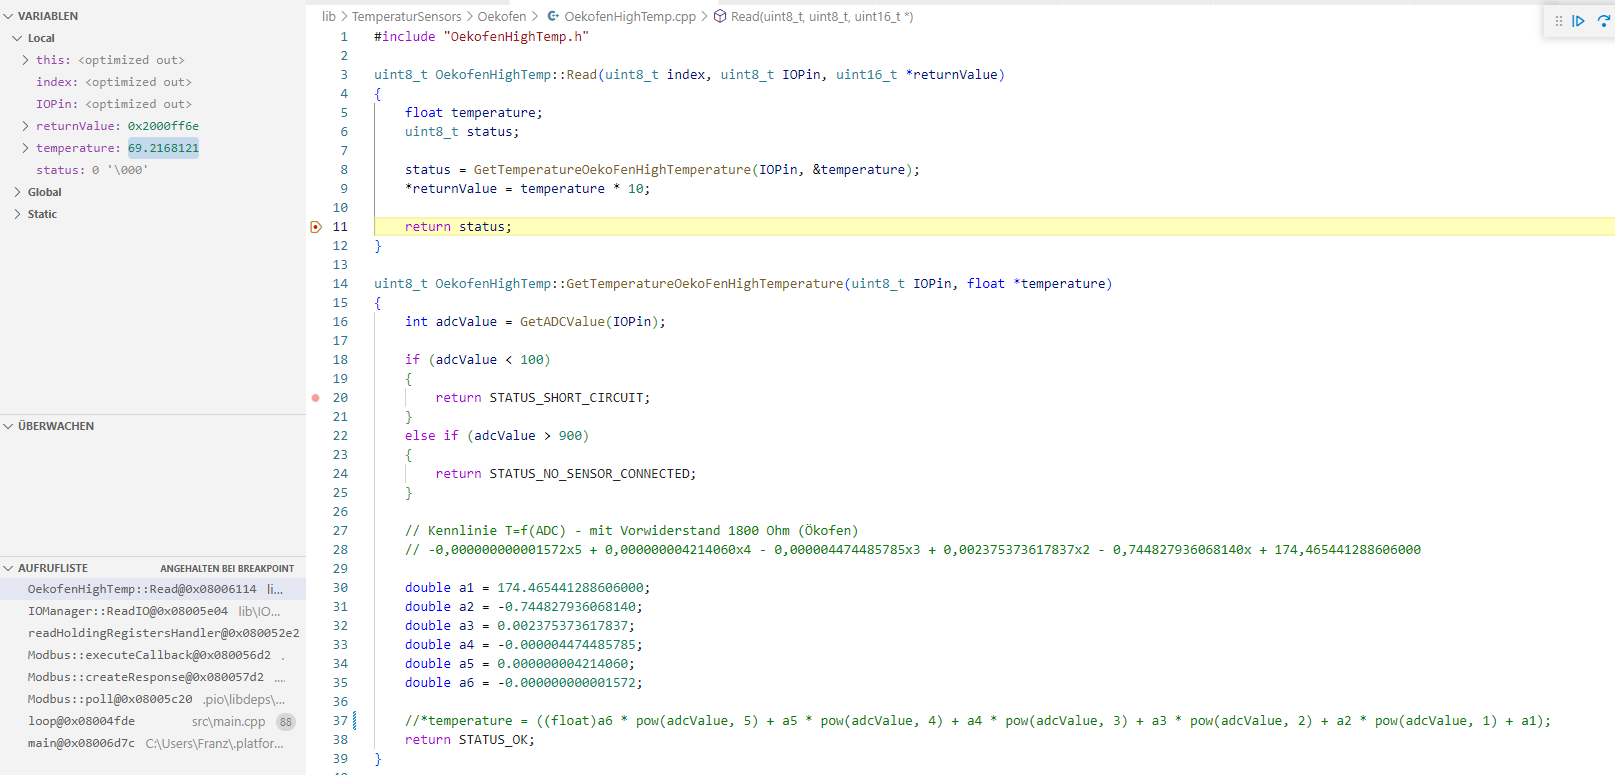
uint8_t OekofenHighTemp::GetTemperatureOekoFenHighTemperature(uint8_t IOPin, float *temperature)
{
int adcValue = GetADCValue(IOPin);
if (adcValue < 100)
{
return STATUS_SHORT_CIRCUIT;
}
else if (adcValue > 900)
{
return STATUS_NO_SENSOR_CONNECTED;
}
// Kennlinie T=f(ADC) - mit Vorwiderstand 1800 Ohm (Ökofen)
// -0,000000000001572x5 + 0,000000004214060x4 - 0,000004474485785x3 + 0,002375373617837x2 - 0,744827936068140x + 174,465441288606000
double a1 = 174.465441288606000;
double a2 = -0.744827936068140;
double a3 = 0.002375373617837;
double a4 = -0.000004474485785;
double a5 = 0.000000004214060;
double a6 = -0.000000000001572;
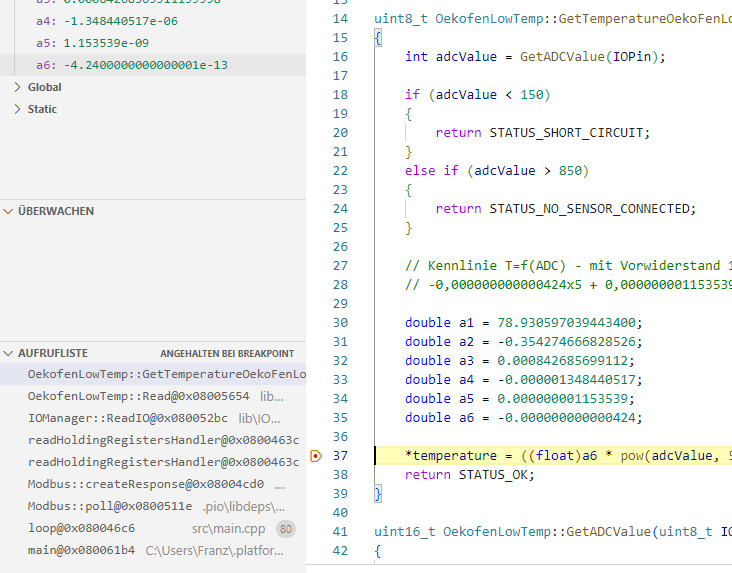
// this line and a secound simalar line in another class I commented out and than debuging works
//*temperature = ((float)a6 * pow(adcValue, 5) + a5 * pow(adcValue, 4) + a4 * pow(adcValue, 3) + a3 * pow(adcValue, 2) + a2 * pow(adcValue, 1) + a1);
return STATUS_OK;
}
When I upload the software “normal” (with the compiler optimization) the software has issues and doesn’t work 100%. I have an alive LED which blinks. → mainloop “OK”. But when I send a Modbus command, the alive LED stops.
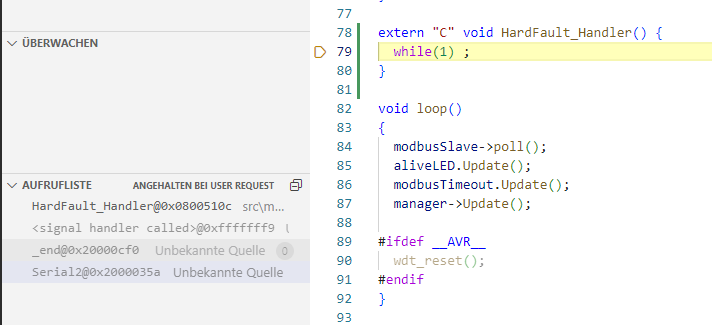
in some .cpp file, e.g., src/main.cpp, so that when a specific crash happens and you pause the software, it at least lands in this function as an indicator that a hardfault, and not some other exception, has happened.
Secondly, can you reproduce the crash where it, when you halt it, it does
Just so that we’re clear, “with compiler optimization” is “debug_build_flags = -Os -g -ggdb3 line is active”?
This stacktrace is really interesting, because the “Serial@0x200…” is an address in RAM, and with that in the backtrace it looks like code was executed from there – although all code belonging to the hardware serial class should be in flash, which is starting at 0x08000000. I’m not sure how code execution could fall in there, especially since there is no element before “Serial2@…”. And _end is the end of allocated memory where the stack should start. It’s not making a lot of sense to me.
A thing you can do is when you are in the exact above hardfault handler is to examine the Cortex-M4’s fault registers. The “Debug Console” VSCode tab gives you access to the GDB console. In reference to Documentation – Arm Developer, please execute the commands
I see. Sadly the cortex-m4 system control block registers don’t give a lot of helpfull information when decoded here.
CFSR = 0x1
     = IACCVIOL ("MPU or Execute Never (XN) default memory map access violation on an instruction fetch has occurred. The fault is signaled only if the instruction is issued.")

HFSR = 0x40000000
     = FORCED ("Processor has escalated a configurable-priority exception to HardFault.")

DFSR = 0x2
     = BKPT ("Indicates a debug event generated by BKPT instruction execution or a breakpoint match in FPB")

MMAR = 0xE000ED38
BFAR = 0xE000ED3C
All it’s saying is that it has an instruction access violation. (The memory manage address register / MMAR is not valid because the MMARVALID in the CFSR is not set – see here for decoding)
Do I understand it correctly that when the hardfault occurrs only when the *temperature = ... line is active?
I think you have a lot of experience and seen a lot of issues. What do you think / feeling? Is my issue caused by the project source code or from something else?