Serial3 Not Working

Can you show a picture of your setup? A STLink is definitely detected, but it can’t connect to the Due.

SWDIO, SWCLK, RESET and GND need to be connected between the Due and the STLink.
Additionally, the Due needs to be powered (e.g. via USB).

Of course. I can show you setup. I did also connect it to USB. But here are some pictures. Before I show the pictures, I will mention that I tried this same setup with both a USB and AC socket as power and they both resulted in the same error.


Also, does it matter if the power is supplied through Programming port or Native Port? I also used 5v supply and 6v supply when connecting to the AC socket.

I also think I should mention that I was able to get my hands on one of these from a friend of mine at school

However, when connecting it and running a debug, I still got 2 errors, except the “Unable to set adapter speed” error was switched out with one saying that the target voltage was too low.

Your wiring looks perfect. You even recogninized that the pinout diagram above didn’t list the pins in-order and plugged them in correctly.

This post confirms it should be working on ST-Link v2. There’s also this config file but it’s basically the same as the command above already.

The “unable to set adapter speed” may be a smoking gun here, that shouldn’t fail with the default speed of 500kHz, it should just adjust to use 480kHz instead.

Can you please set

debug_speed = 480

in the platformio.ini and try debugging again? Is the error message now gone in the Debug Console?

In addition to that, the firmware version on your STLink is not yet up-to-date (V2J29S7).

The newest one is V2J40S7

You can get the update tool after an account registration from

https://www.st.com/content/st_com/en/products/development-tools/software-development-tools/stm32-software-development-tools/stm32-programmers/stsw-link007.html

Or I also uploaded it at Deleted

The update worked with my device just fine.

Setting debug_speed:
image

Just to make sure, after clicking on the run and debug tab, I just need to run the debug on the “PIO Debug” configuration, right? Because besides that I am not doing anything else in the debug section besides switching from Debug Console to Terminal, and vice versa.
image

This was the result of changing the debug_speed and running the PIO Debug
image

I will follow your instruction on updating immediately after this.

Upgrade was successful.

After updating, I received a new message when running the PIO Debug.

image

Okay so we went from having no connection to the chip at all to having a connection but failing to flash. Some progress. Sad this not working out of the box.

Can you rerun the command from above? What does it say now?

If the program has connected successfully, use Ctrl+C to stop it again.

Seems to have had a bit of progress.
Did I do the Ctrl+C correctly? I am still new to command prompt as well.

After this step I ran a PIO Debug again, and I received the same exact error about “no flash bank”.

Yes, it very succesfully discovered and connected to the Cortex-M3 processor. Very good.

This is now a PlatformIO fault that it wants to flash to address 0x0. Lookg at the datasheet’s memory mapping, it looks to me like 0x0 is where the bootloader is (if this is non-modifyble we can’t write stuff there) and 0x80000 is where the actual internal flash is where the program should live.

Let me just double-check these memory addresses and how PlatformIO links the application and see how we can solve this very likely bug.

Now I also get why videos like PlatformIO Tutorial: programming Arduino DUE with Atmel-ICE / ST-Link - YouTube use a custom script that use the 0x80000 address to fix PlatformIO’s bug.

1 Like

Actually, the platform might have a configuration option there that might correct it.

Can you add

board_upload.offset_address = 0x80000

to the platformio.ini and retry debugging?

Of Course.
image


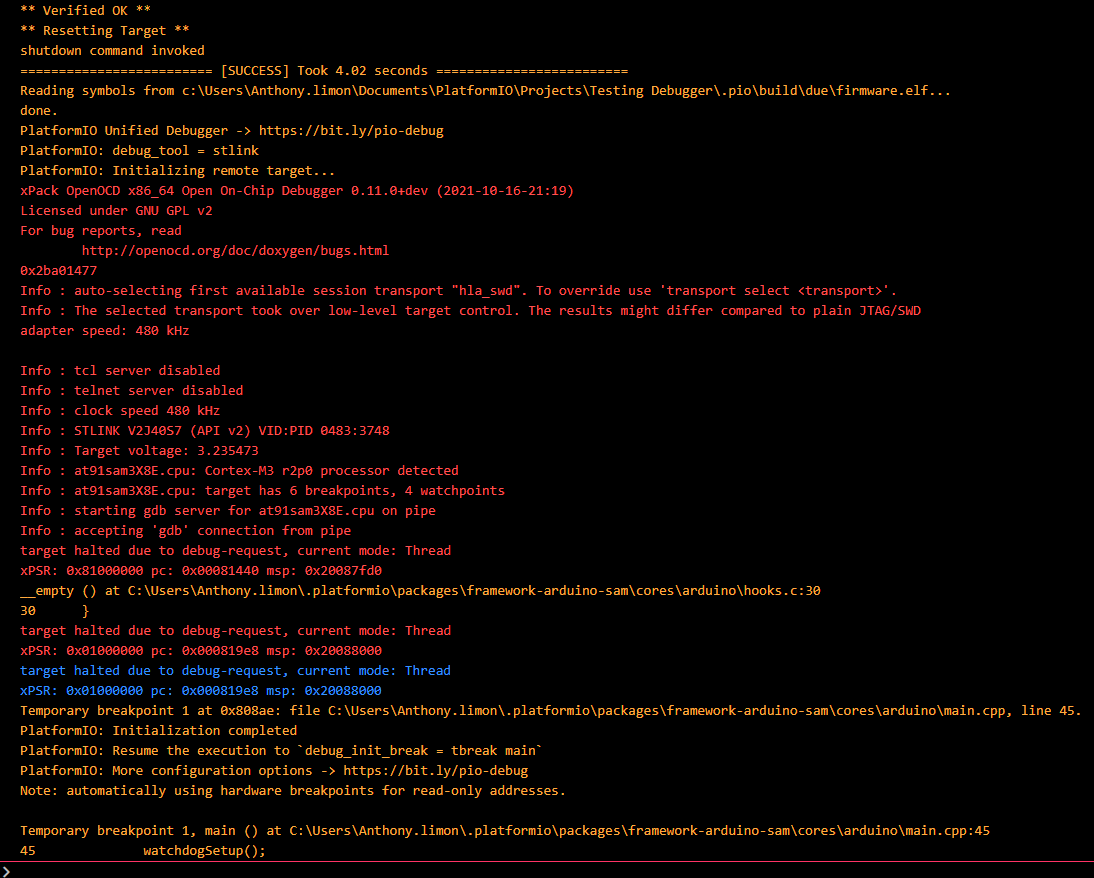
There seems to have been success! Do I need to worry about any of the ‘target halted’ messages.

I guess my real question is, do you see any errors? I assume that I will get used to this the more I work with the debugger.

No, that’s actually good and says that the debugging probe (STLinkv2) was able to halt execution on the chip so that it can read out the memory (for variables etc.) in peace. You’d have to worry about “failed to halt target” messages if there were any.

The output look very good. Can you stop debugging (stop button) and add

debug_init_break = break setup

(docs) to the platformio.ini.

Then if you start debugging now and if everything works it should now halt in the setup() function of your firmware code, indicated by a highlighted red or yellow line in the source code (“current execution position”). From there you can try to use the “step over” (arrow) button to step over the lines of code in your firmware.

1 Like

I see, it seems as if there gets to a point where I can not step over anymore. Is there a way to get into the loop part of the program? Or is that something I learn by just getting familiar with debuggers.

However, adding the debug_init_break = break setup indeed made a stop at the setup.

What’s the last line you can still step over?

It is the last line of code in setup. After that there is only a pause option, which if I hit, takes me to a location in a random default file location. The two times I have tried hitting pause (it being one of the only options to click, besides stop), I have been left in wiring.c and hooks.c.

After the debugger halts in setup(), place a setup in the loop() function by clicking to the left of the line number.

grafik

Then press the “Play” button to resume execution. Does it hit the breakpoint in loop() or does it never reach there?

It does not stop there.

establishContact which is in the setup is the last thing to get highlighted before my options look like this:
image

Okay. Press the pause button. There should be a “Call Stack” on the left side which will tell you exactly how it got into the place it halted at. You can click at each individual function. Does one of the higher level ones trace back to your code? Maybe it blocks execution until the serial port is opened and a byte or something is sent?

You can also always open a separate serial monitor if you need it to establish the serial connection to your board as your sketch requires it. I like using programs like HTerm - der-hammer for it.

1 Like

I do think that the Serial communication is what is stopping the program it seems.