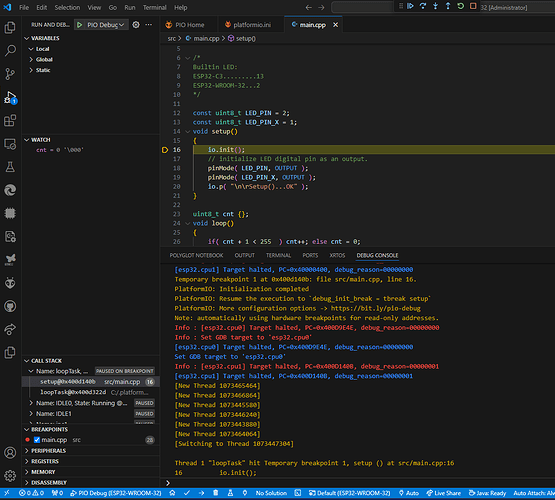
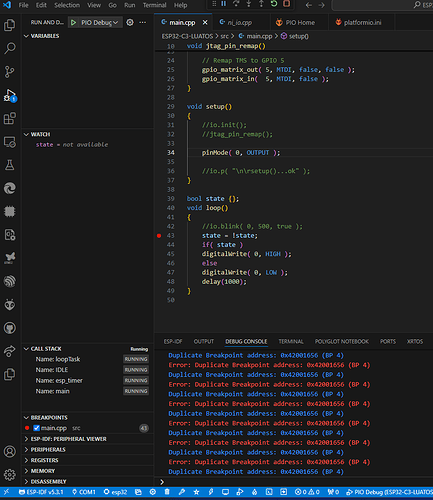
[Resolved] Error: Duplicate Breakpoint address: 0x42001656 (BP 3)

Microsoft Windows 11 Version 22H2 (OS Build 22621.4249)
PlatformIO Core 6.1.16·Home 3.4.4 ( airm2m_core_esp32c3 board selected )
ESP-IDF Version: 1.8.1
ESP32-C3 LuatOS cloned board
Zadig 2.9 (Build 788)
FTDI driver CDM212364_Setup

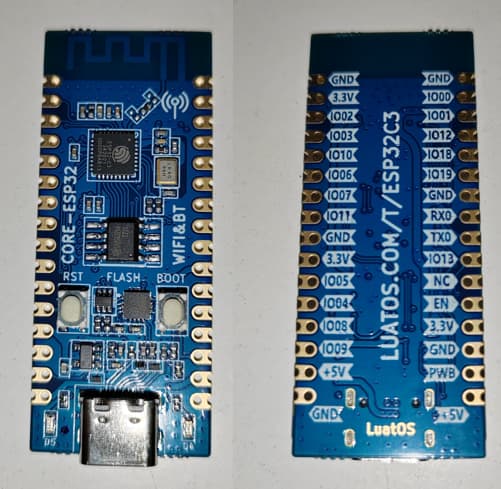
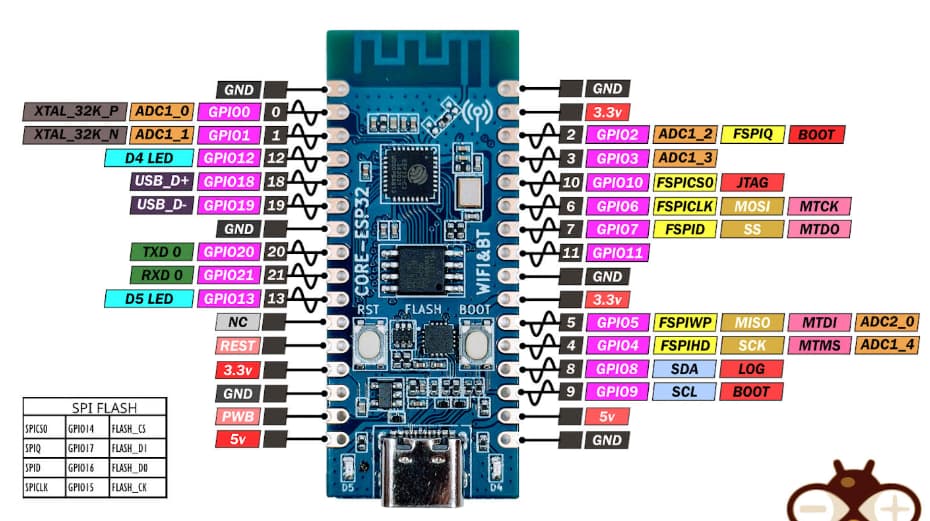
I am using the ESP32-C3 32 pins board as show below,

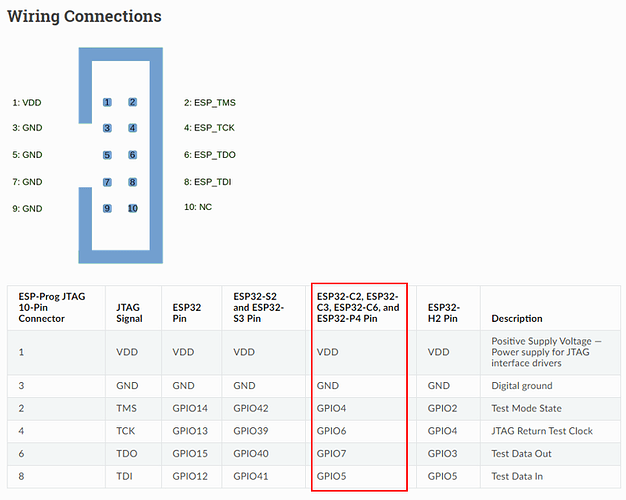
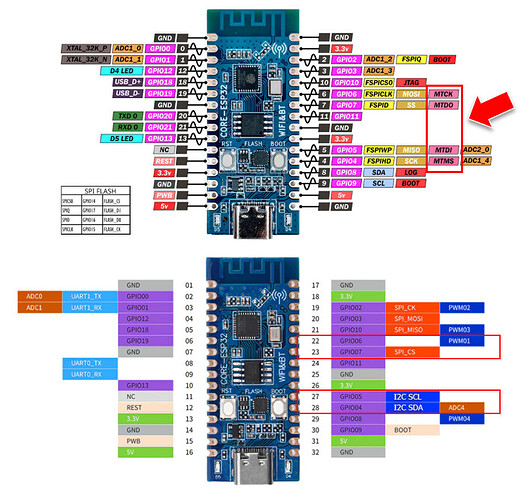
This board does not has the pins GPIO 14 and 15 therefore I connected based on the red rectangle column below which is from this link.

However, I did not connect the VDD from the ESP_Prog to the +5V of ESP32-C3 board ( Lowest left, 1st pin ) as is powered by the USB connection. Even I connected the ESP_Prog’s VDD to that +5V pin of ESP32-C3 board, the result still the same. Later, I set the ESP_Prog to +3.3V where the VDD of ESP_Prog is not connect to any pin, result still the same.

It is able to upload successfully but failed at debug stage.

image

Here is the debug console error messages in details.

The launch.json file is HERE.

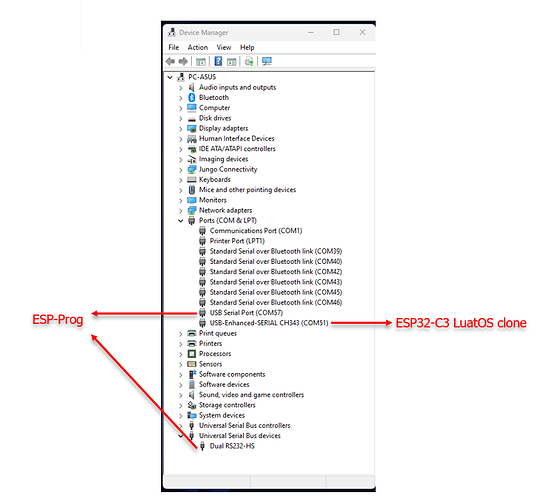
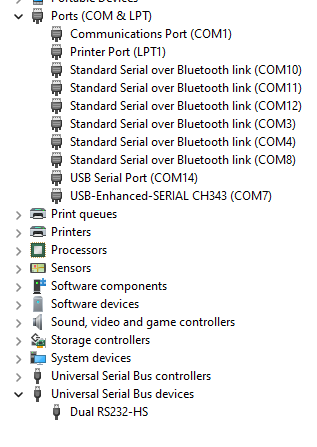
Below is the Device Manager’s info after using Zadig to replace to WinUSB driver.

The platform.ini is below.

[env:esp32-c3-devkitc-02]
platform = espressif32
board = esp32-c3-devkitc-02
framework = arduino
monitor_port = COM57
monitor_speed = 9600
upload_port = COM51
debug_tool = esp-prog
debug_init_break = tbreak setup

I also changed and selected AirM2M CORE ESP32C3 board as mentioned in the LuatOS’s website regarding its ESP32-C3 board but result still the same.

Please advise.
Ok, after selected airm2m_core_esp32c3 board, now the blinking sketch did work correctly, the current platformio.ini is as below.

[env:airm2m_core_esp32c3]
platform = espressif32
board = airm2m_core_esp32c3
framework = arduino
upload_port = \\.\COM51
debug_tool = esp-prog
debug_init_break = tbreak setup

Now, the error message below.

image

Debug console messages:

undefinedC:\.platformio\packages\toolchain-riscv32-esp\bin\riscv32-esp-elf-gdb.exe: warning: Couldn't determine a path for the index cache directory.
Reading symbols from C:\DEMO\Arduino\Projects\ESP32-C3\.pio\build\airm2m_core_esp32c3\firmware.elf...
PlatformIO Unified Debugger -> https://bit.ly/pio-debug
PlatformIO: debug_tool = esp-prog
PlatformIO: Initializing remote target...
Open On-Chip Debugger v0.11.0-esp32-20220706 (2022-07-06-15:48)
Licensed under GNU GPL v2
For bug reports, read
http://openocd.org/doc/doxygen/bugs.html
adapter speed: 20000 kHz
adapter speed: 5000 kHz
Info : tcl server disabled
Info : telnet server disabled
Error: failed to reset FTDI device: LIBUSB_ERROR_PIPE
Error: unable to open ftdi device with vid 0403, pid 6010, description '*', serial '*' at bus location '*'
Error: no device found
Error: unable to open ftdi device with vid 0403, pid 6014, description '*', serial '*' at bus location '*'
Error: Unsupported xlen: -1
Error: Unknown target arch!
.pioinit:11: Error in sourced command file:
Remote communication error. Target disconnected.: Success.

Please advise.

I removed all FTDI driver, uninstall ESP-Prog devices listed under Device Manager and re-installed FTDI latest driver and do the Zadig process again.

image

However, I still get the errors below.

image

undefinedC:\.platformio\packages\toolchain-riscv32-esp\bin\riscv32-esp-elf-gdb.exe: warning: Couldn't determine a path for the index cache directory.
Reading symbols from C:\DEMO\Arduino\Projects\ESP32-C3\.pio\build\airm2m_core_esp32c3\firmware.elf...
PlatformIO Unified Debugger -> https://bit.ly/pio-debug
PlatformIO: debug_tool = esp-prog
PlatformIO: Initializing remote target...
Open On-Chip Debugger  v0.11.0-esp32-20220706 (2022-07-06-15:48)
Licensed under GNU GPL v2
For bug reports, read
	http://openocd.org/doc/doxygen/bugs.html
adapter speed: 20000 kHz

adapter speed: 5000 kHz

Info : tcl server disabled
Info : telnet server disabled
Info : clock speed 5000 kHz
Error: JTAG scan chain interrogation failed: all zeroes
Error: Check JTAG interface, timings, target power, etc.
Error: Trying to use configured scan chain anyway...
Error: esp32c3.cpu: IR capture error; saw 0x00 not 0x01
Warn : Bypassing JTAG setup events due to errors
Error: dtmcontrol is 0. Check JTAG connectivity/board power.
Warn : target esp32c3 examination failed
Info : starting gdb server for esp32c3 on pipe
Info : accepting 'gdb' connection from pipe
Error: Target not examined yet
Error executing event gdb-attach on target esp32c3:

Warn : No symbols for FreeRTOS!
Error: Target not halted
Error: auto_probe failed
Error: Connect failed. Consider setting up a gdb-attach event for the target to prepare target for GDB connect, or use 'gdb_memory_map disable'.
Error: attempted 'gdb' connection rejected
Error: error during select: Unknown error
.pioinit:11: Error in sourced command file:
Remote communication error.  Target disconnected.: Success.

By the way, I connected both ESP32-C3 board and ESP-Prog via a USB3.0 hub, does it matter ?

Any help is greatly appreciated.

I used back the same source code and platformio.ini for debugging the ESP32-WROOM-32, it is able to debug successfully.

This proved the ESP-Prog is working, the debug console messages is HERE.

I found the debug_speed cannot be more than 500 otherwise the inline debugging will not start.

Will continue to test the ESP32-C3 board and see.

Any suggestion is greatly appriciated.

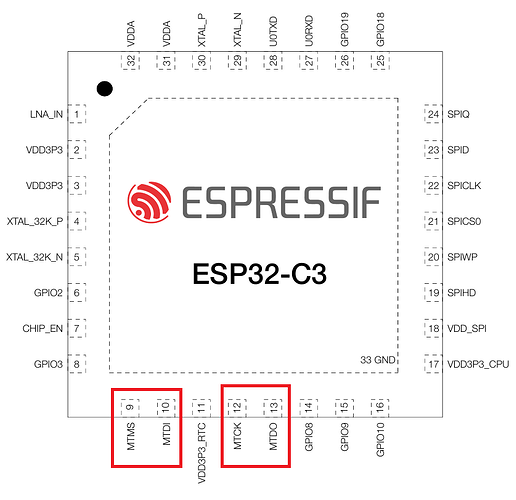
Today, I found out from the datasheet, the pin MTMS, MTCK, MTDO and MTDI are available in the ESP32-C3 chip as shown below.

Below are two different boards with different pins layout.

The way they map the peripheral interfaces are so different.

In this case, I have get the genuine version of this board to be sure of, not to say I don’t like the ESP32-C3 DevKitC-02 board, is just that this clone boards are using castellated pins, easier to direct implement on a project.

I suspected this ESP32-C3 clone board does not built with JTAG interface as the peripheral interfaces ( MTMS, MTCK, MTDO and MTDI ) are not mentioned in its product page.

Anyone knows where to get this ESP32-C3 clone board with JTAG pins interface ( MTMS, MTCK, MTDO and MTDI ), or successfully using JTAG to step debug this board, please share some information here, your help is much appreciated.

Thank you.

Today, I tested a new LuatOS ESP32-C3 dev board with AirM2M ESP32-C3 board option selected, from the recommended link from this site.

image

I still received error messages below.

undefinedC:\.platformio\packages\toolchain-riscv32-esp\bin\riscv32-esp-elf-gdb.exe: warning: Couldn't determine a path for the index cache directory.
Reading symbols from C:\DEMO\Arduino\Projects\ESP32-C3-LUATOS\.pio\build\airm2m_core_esp32c3\firmware.elf...
PlatformIO Unified Debugger -> https://bit.ly/pio-debug
PlatformIO: debug_tool = esp-prog
PlatformIO: Initializing remote target...
Open On-Chip Debugger  v0.11.0-esp32-20220706 (2022-07-06-15:48)
Licensed under GNU GPL v2
For bug reports, read
	http://openocd.org/doc/doxygen/bugs.html
adapter speed: 20000 kHz

adapter speed: 5000 kHz

Info : tcl server disabled
Info : telnet server disabled
Error: libusb_open() failed with LIBUSB_ERROR_NOT_SUPPORTED
Info : clock speed 5000 kHz
Error: JTAG scan chain interrogation failed: all zeroes
Error: Check JTAG interface, timings, target power, etc.
Error: Trying to use configured scan chain anyway...
Error: esp32c3.cpu: IR capture error; saw 0x00 not 0x01
Warn : Bypassing JTAG setup events due to errors
Error: dtmcontrol is 0. Check JTAG connectivity/board power.
Warn : target esp32c3 examination failed
Info : starting gdb server for esp32c3 on pipe
Info : accepting 'gdb' connection from pipe
Error: Target not examined yet
Error executing event gdb-attach on target esp32c3:

Warn : No symbols for FreeRTOS!
Error: Target not halted
Error: auto_probe failed
Error: Connect failed. Consider setting up a gdb-attach event for the target to prepare target for GDB connect, or use 'gdb_memory_map disable'.
Error: attempted 'gdb' connection rejected
Error: error during select: Unknown error
.pioinit:11: Error in sourced command file:
Remote communication error.  Target disconnected.: Success.

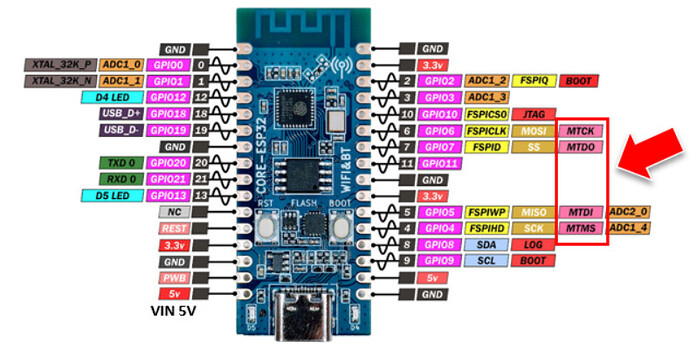
I already configured correctly based on the JTAG pins below.

For the moment, waiting for next ESP-Prog unit which claim to be original. Meanwhile, any suggestion is appreciated.

Found something, if direct connect the ESP-Prog to USB of PC without using USB hub, there is no “Error: libusb_open() failed…” error message.

undefinedC:\.platformio\packages\toolchain-riscv32-esp\bin\riscv32-esp-elf-gdb.exe: warning: Couldn't determine a path for the index cache directory.
Reading symbols from C:\DEMO\Arduino\Projects\ESP32-C3-LUATOS\.pio\build\airm2m_core_esp32c3\firmware.elf...
PlatformIO Unified Debugger -> https://bit.ly/pio-debug
PlatformIO: debug_tool = esp-prog
PlatformIO: Initializing remote target...
Open On-Chip Debugger  v0.11.0-esp32-20220706 (2022-07-06-15:48)
Licensed under GNU GPL v2
For bug reports, read
	http://openocd.org/doc/doxygen/bugs.html
adapter speed: 20000 kHz

adapter speed: 1000 kHz

Info : tcl server disabled
Info : telnet server disabled
Info : clock speed 1000 kHz
Error: JTAG scan chain interrogation failed: all zeroes
Error: Check JTAG interface, timings, target power, etc.
Error: Trying to use configured scan chain anyway...
Error: esp32c3.cpu: IR capture error; saw 0x00 not 0x01
Warn : Bypassing JTAG setup events due to errors
Error: dtmcontrol is 0. Check JTAG connectivity/board power.
Warn : target esp32c3 examination failed
Info : starting gdb server for esp32c3 on pipe
Info : accepting 'gdb' connection from pipe
Error: Target not examined yet
Error executing event gdb-attach on target esp32c3:

Warn : No symbols for FreeRTOS!
Error: Target not halted
Error: auto_probe failed
Error: Connect failed. Consider setting up a gdb-attach event for the target to prepare target for GDB connect, or use 'gdb_memory_map disable'.
Error: attempted 'gdb' connection rejected
Error: error during select: Unknown error
.pioinit:11: Error in sourced command file:
Remote communication error.  Target disconnected.: Success.

After days of searching, found some information below in order to step debug.

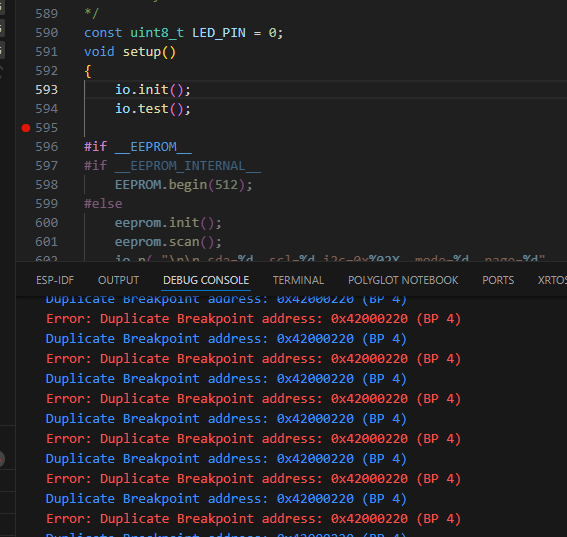
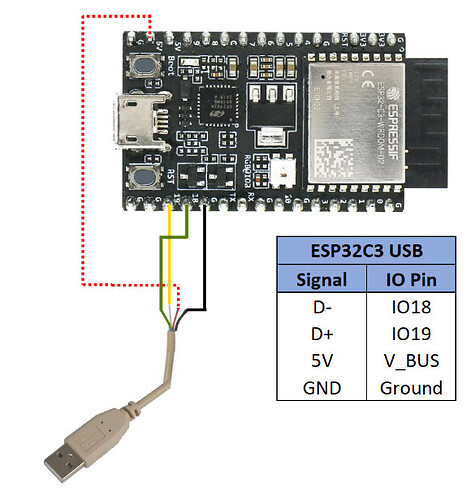
  1. Using USB cable with USB Micro breakout board which its D+ to pin19, D- to pin18, based on video HERE. However, this approach so far tested with error messages below after step over to line 595, where io.init() and .test() are own source library (none 3rd party). It just repeatedly printed error message below.

  1. Set the DIS_USB_JTAG Fuse as described HERE.

ATTENTION: Burning fuses is a one time thing!
Please carefully read the 2nd paragraph:

Burning DIS_USB_JTAG eFuse will permanently disable the connection between USB_SERIAL_JTAG and the JTAG port of the ESP32-C3. JTAG interface can then be connected to GPIO4-GPIO7. Note that USB CDC functionality of USB_SERIAL_JTAG will still be usable, i.e., flashing and monitoring over USB CDC will still work.

1 Like

Yes, I am aware of it cannot be reverted after fuse is burnt, I am trying now as got few clone ESP32-C3 boards to test :slight_smile:

Ok, just tested and after burning the fuses as shown HERE,

I am able to use the ESP-Prog to access the JTAG pins MTMS, MTCK, MTDO and MTDI then can step debug but same error messages encountered below.

Whenever stepping over Arduino’s API like “pinMode” below, it kept showing “Error: Duplicate Breakpoint address: 0x…”, is the same message as the use of USB JTAG connection.

In fact, I used a plain blinky program to test it and removed unwanted routines.

At least, now resolved the problem of JTAG interface on ESP32-C3.

The platformio.ini is below.

[env:airm2m_core_esp32c3]
platform = espressif32
board = airm2m_core_esp32c3
framework = arduino

; ESP-Prog default USB serial port COM19
upload_port = \\.\COM19
upload_protocol = esp-prog
debug_tool = esp-prog

debug_init_break = tbreak setup
debug_speed = 1000

build_type = debug

lib_deps =
plerup/EspSoftwareSerial@^8.2.0
arduino-libraries/ArduinoBLE@^1.3.7
olikraus/U8g2@^2.35.30

The ESP-Prog step debugging messages are HERE.

Why the the DEBUG CONSOLE kept showing “Error: Duplicate Breakpoint address: 0x42001656 (BP 4)” whenever I step over a routine call, and this time is just the “pinMode” routine ?

I also used the USB JTAG D+ D- method to debug the genuine ESP32-C3-DevKitC-02 board, the same error messages showing continuously as well.

While I am waiting for the genuine ESP-Prog to arrive, any suggestion or help is greatly appreciated.

I found the solution, after I removed the “debug_init_break = tbreak setup” from the platformio.ini, I am able to step debug via F5, F10 on both methods via the USB JTAG D+ D- and the ESP-Prog (fuse burning) on ESP32-C3-DevKitC-02 and airm2m_core_esp32c3 board as usual.

Hopes, this help.

Thank you.

1 Like

Just to inform that, I tested the above-mentioned methods via USB D+ D- and FUSE burning, step debugging do not work on the ESP32-C3-ZERO (does not work even with pin 18,19), SUPER MINI (no pin 18,19 exposed) board.

For the use of USB D+ D- debugging method, I think the correct pins for D+ D- of airm2m_core_esp32c3 board should look like below as I tested using D+ as GPIO19, D- as GPIO18, the USB serial port can be detected by Windows 11 successfully via a Micro USB breakout board.

image

based on the picture below from Visual Micro.

The best practice is to debug on full pins board, then upload the tested program to these mini ESP32-C3 to be safe.

Thanks again.