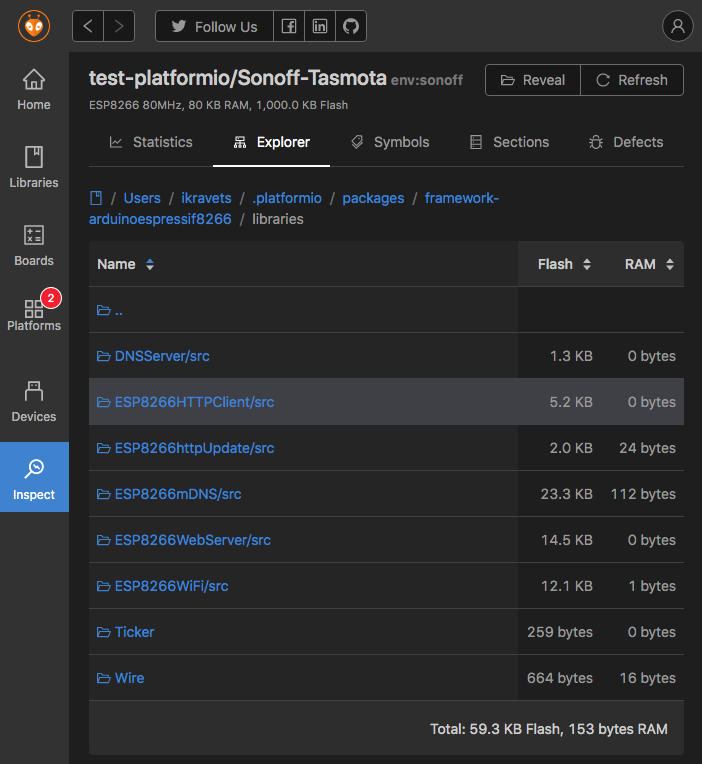
We are glad to announce a new beta version of the PlatformIO Home, where several new features and improvements will be released including a completely new advanced tool called Project Inspector!
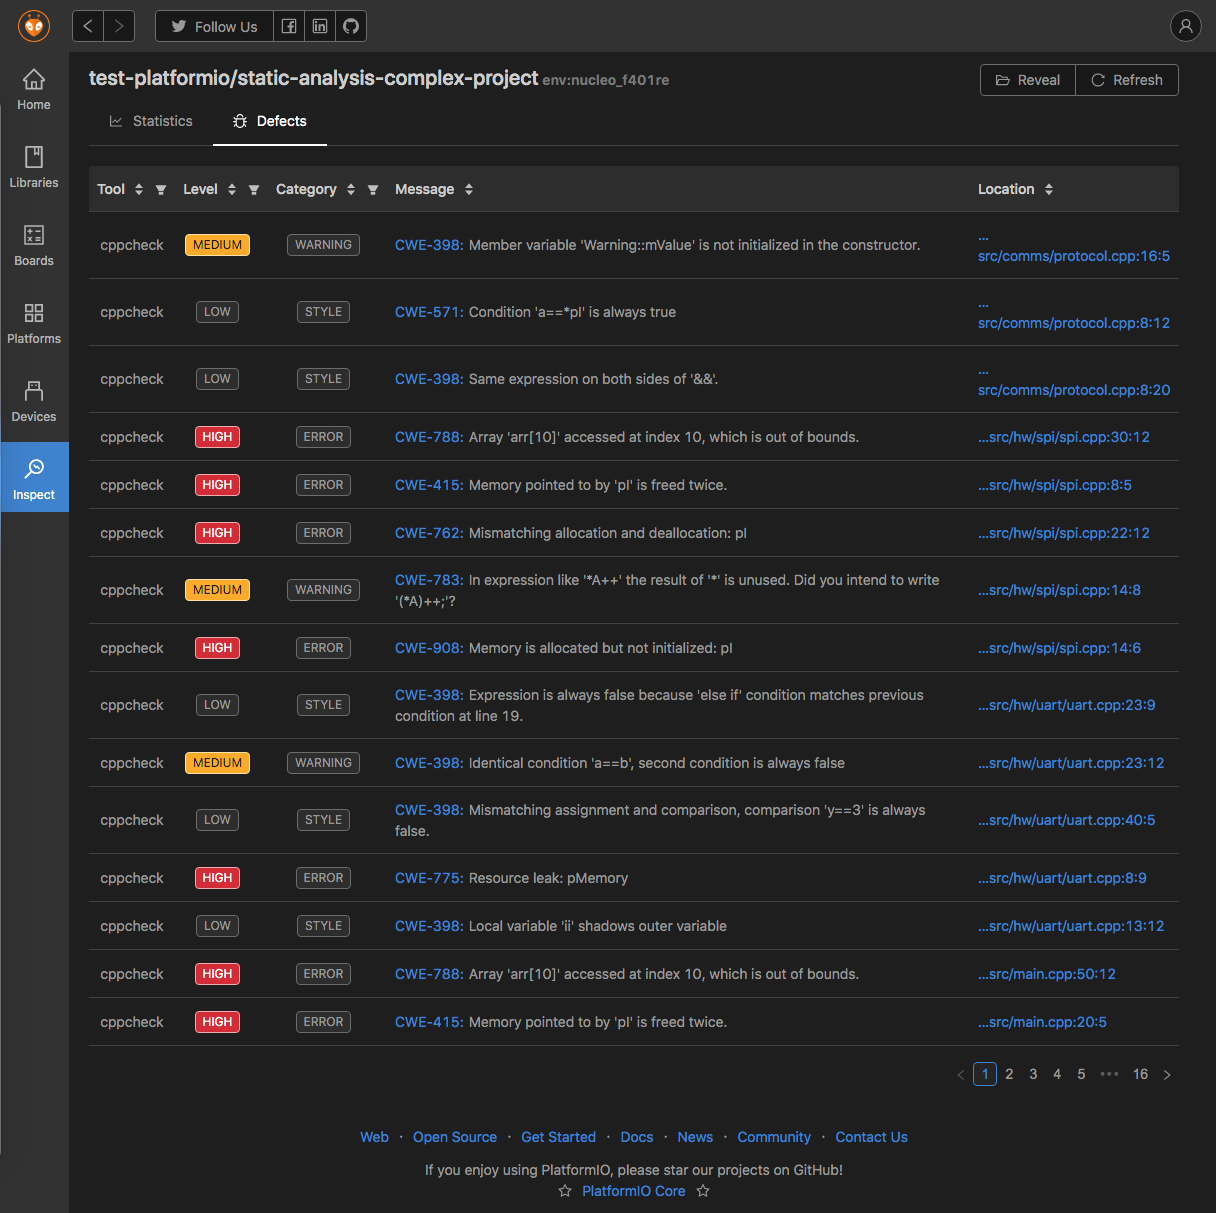
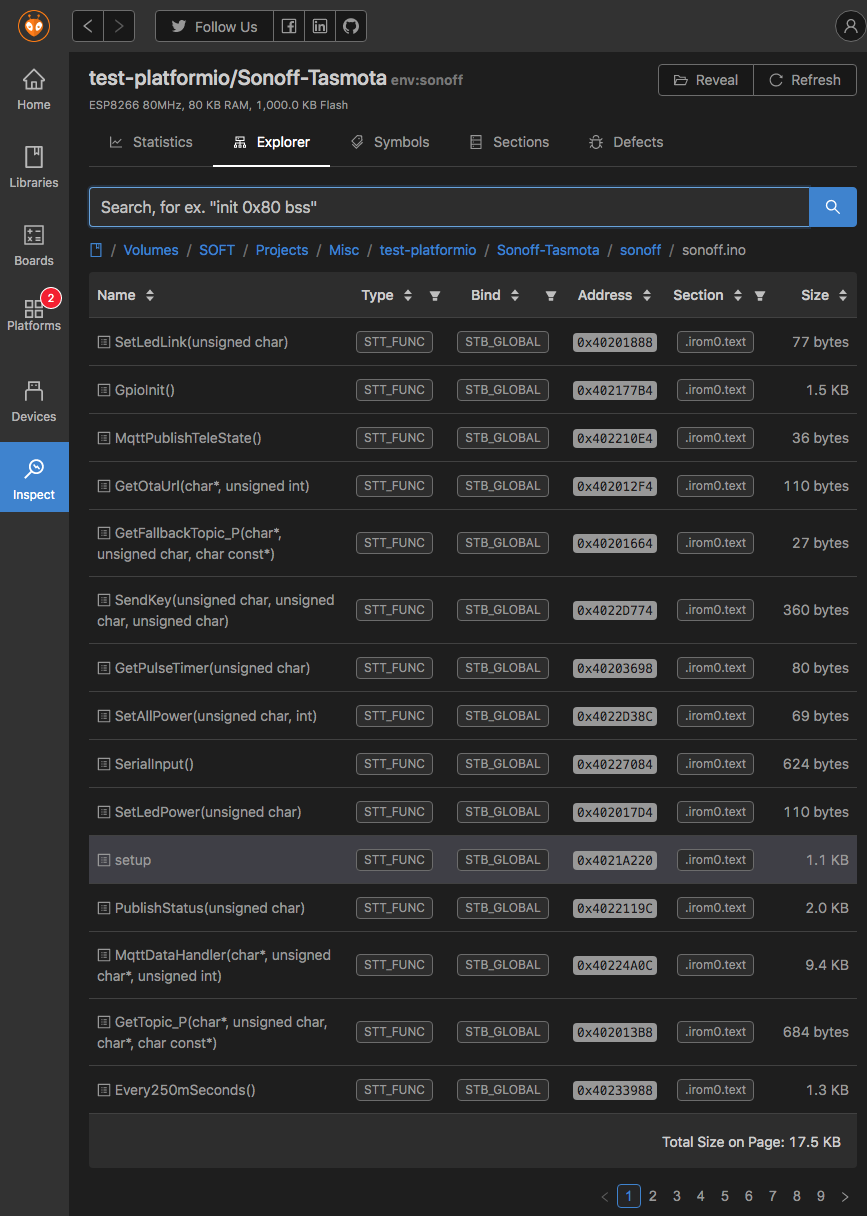
Firmware File Explorer Memory Inspection Symbols and Sections Explorer Static Code Analysis (based on PIO Check)
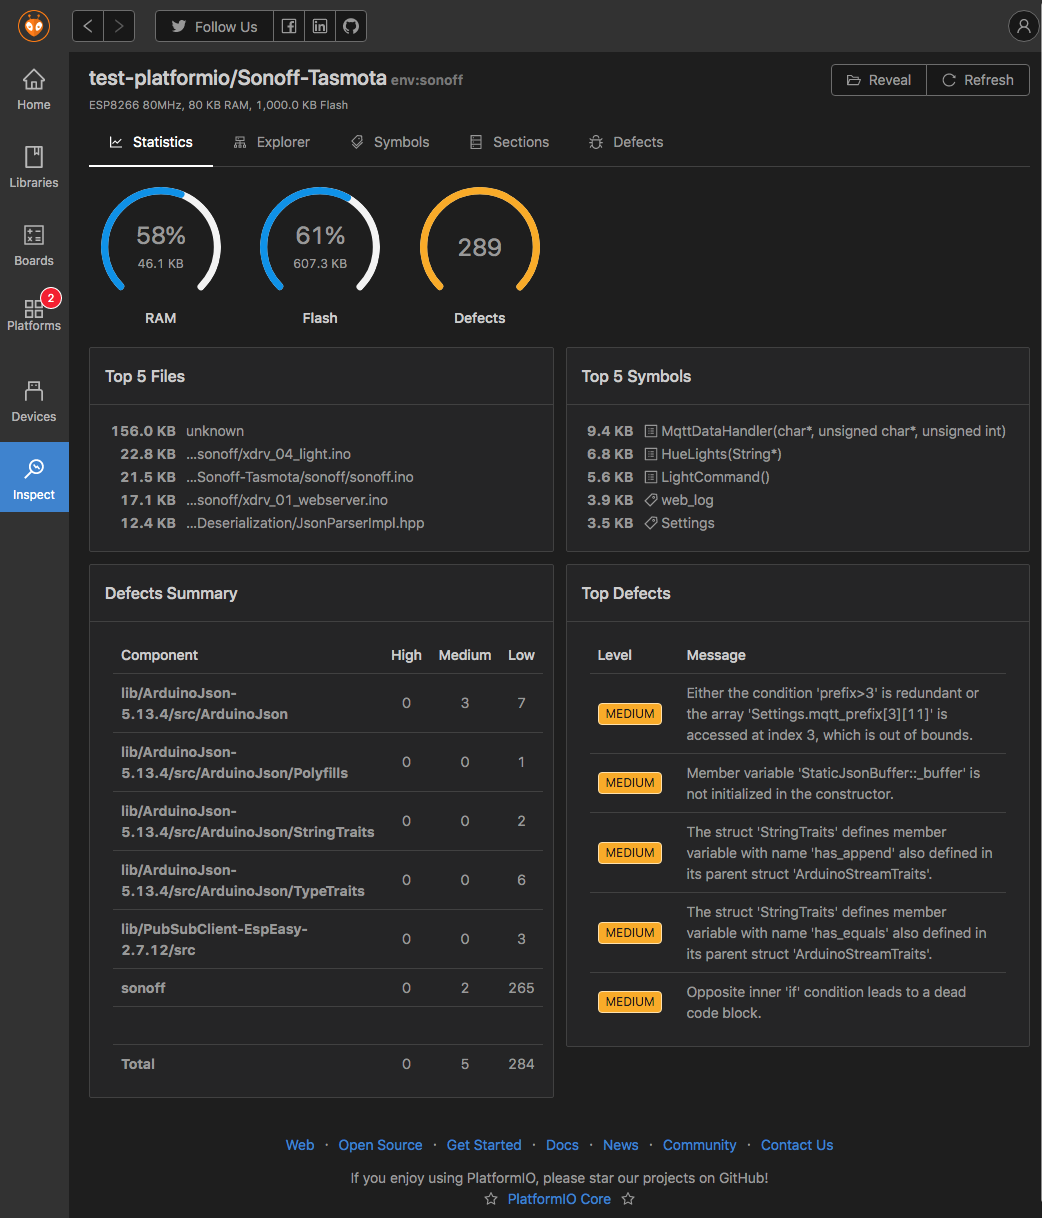
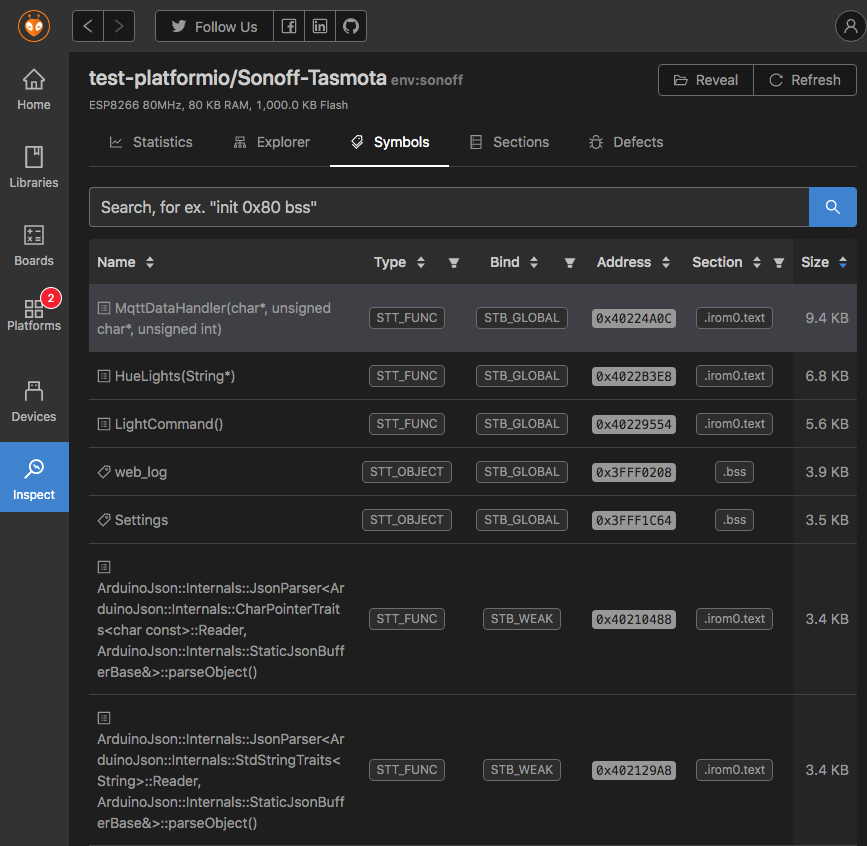
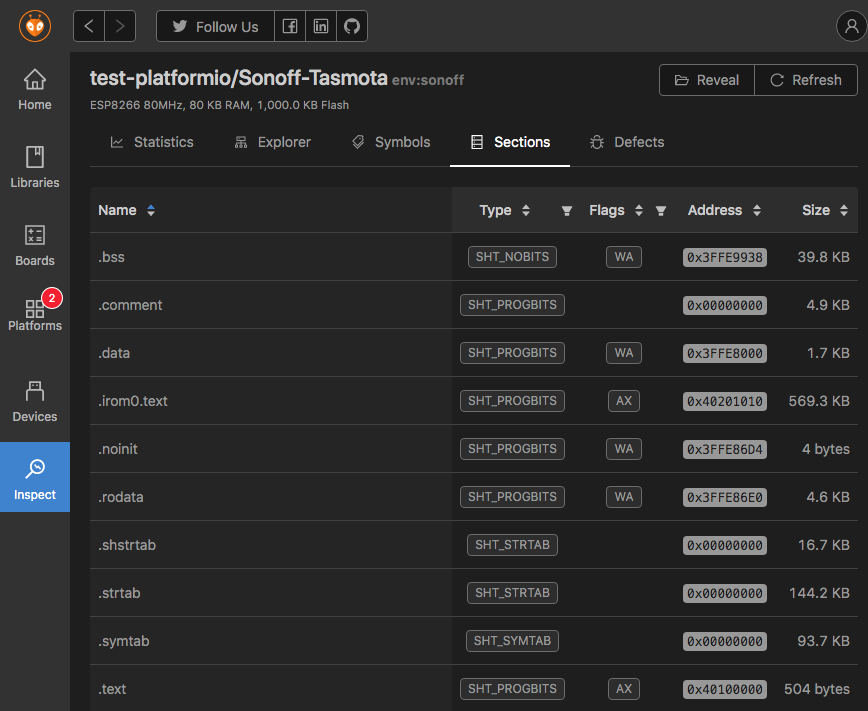
Have you ever taken an interest in how the linker is assigning physical memory, where your code is placed in Flash, or how much RAM is used by OS or peripheral drivers? The Project Inspector can easily answer these questions. You can use the Project Inspector to analyze application memory usage or to answer specific questions about in which memory section a variable or function is placed
Now we can cover all* phases of the embedded software engineering processes that are implemented in one ecosystem: development, testing, debugging, static analysis, memory inspection!
*Probably not all, CPU profiling is still missing
The new PlatformIO Home 3.0 will come together with the final release of PlatformIO Core 4.1. If you would like to try the latest stable PlatformIO Core RC version, please do the next:
PlatformIO IDE for VSCode: Open VSCode Settings and enable “Use development version of PlatformIO Core (CLI)”. Restart VSCode
PlatformIO Core or PlatformIO IDE Terminal: Run pio upgrade --dev command in terminal. Start pio home which will open GUI in your system browser.
Ok… have to stop drooling over this… it’s really, really, REALLY cool! The code analysis / project inspection is fantastic… being able to see a breakdown of what libraries / functions / code / etc are using flash and ram is priceless… and the code defect analysis will be invaluable also… great work guys! Gave it a quick whirl with an atmega328 Arduino project and an esp8266 Arduino project, and it worked like a treat, and the PIO Home interface breaks it all down nicely and makes it easy to digest and understand.
My only requests or suggestions so far would be, if possible to have some sort of feedback after the Inspect button is pressed… as at present you press the button, and it just spins around until it’s ready… which can sometimes take a while… Not saying it should have an ETA or progress (unless an somewhat accurate progress text or bar is possible) … but at least stages… i.e. compile… inspect… code inspect… whatever…
Also, is it possible to make the locations in the defects table clickabled… since they have complete relative paths and line numbers?
When enabling it, my PIO terminal does greet me with a rather non-descriptive message about execution policies.
PS C:\GitHub\TD-er\ESPEasy> & C:/Users/gijs/.platformio/penv/Scripts/activate.ps1
& : File C:\Users\gijs\.platformio\penv\Scripts\activate.ps1 cannot be loaded because running scripts is disabled on this system. For more information, see about_Execution_Policies at https:/go.microsoft.com/fwlink/?LinkID=135170.
At line:1 char:3
+ & C:/Users/gijs/.platformio/penv/Scripts/activate.ps1
+   ~~~~~~~~~~~~~~~~~~~~~~~~~~~~~~~~~~~~~~~~~~~~~~~~~~~
    + CategoryInfo          : SecurityError: (:) [], PSSecurityException
    + FullyQualifiedErrorId : UnauthorizedAccess
I think it would be helpful to mention what policy is required and what level of security is best to set.
Apparently it is highly impractical to have it set for the Process like this:
Set-ExecutionPolicy -ExecutionPolicy Unrestricted -Scope Process
Should it be set to bypass or unrestricted to properly run the Python venv activate script?
I opened the terminal from the bottom icon in VS code, not via the Home button.
I now have set the execution policy to unrestricted for the current user. By only setting it for the process scope, I had to change the policy every time I opened the terminal within VS code.
I can add an issue for it if you like (core repo?) to keep this discussion a bit more clean.
Open the Inspection view, hit browse, and then hit either cancel or the close button on the dialog, and be rewarded with a blank PIO screen. In Linux anyway…
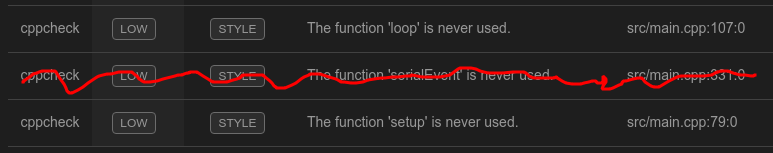
Anyway, where was I… So far, yes, it’s working just great. My only nitpick so far (other than links in the code check report would be nice - although probably impractical due to multiIDE/noIDE nature of PIO, and some idea as to progress while inspection is underway) would be that code checker decided that the setup and loop functions in AVR Arduino projects were unused… when they actually are used… but that’s a minor issue and was at least a low priority defect warning. I’m be sure to read the docs to see how I can configure that how I want it.
@valeros please help here. Also, it would be good to add example here Redirecting... how to excluded “never used” defects from report. Just example, no need to change something in check engine.
I had already done a cppcheck previously on my code, so all the nasty ones were already dealt with.
What I do miss, is a filter to switch on/off some types of reported issues from cppcheck. Now it is a bit hard to browse through them to see what kind of reports there are.
Also it would be really nice to have a CTRL-click option to directly go to the line of code mentioned in the check.
Another nice thing to have is a report of why a check is failing. Now I had to do a separate build first to see it.
Also some very basic progress indicator of what it is doing would be really nice. Now you don’t have a clue for several minutes after pressing the check button.
Cancelling a build in Windows at least does not seem to be possible.
I just noticed if you run the check manually via the terminal (pio check) you can control click the filename/line numbers there… but yes, in the report would be nice if possible Just did a FR for that
I don’t understand what you mean here… do you mean when there is an actual error in the code?
Eeek… hadn’t thought of that… same applies to Linux also… And closing the PIO Home tab doesn’t get you anywhere since the debug build has already been set off. Ouch!
The inspect build does build with debug mode, so the sketch would not fit anymore. So in my own builds it was building just fine, but the inspect build was failing without any error why it failed.
I have now added a special “debug” environment, which does improve inspect speed when I pre-build it