Some days ago I started working with an Freenove ESP32-wrover module and the Arduino IDE. I was able to to do some nice things without bigger problems.
Now, code size and complexity increases and I decided to move to VS-code and PlatformIO. Here my setup:
latest VS code (1.108.1) and PlatformIO (core 6.1.18; Home: 3.4.4) version.
Freenova ESP32-WROVER-E module
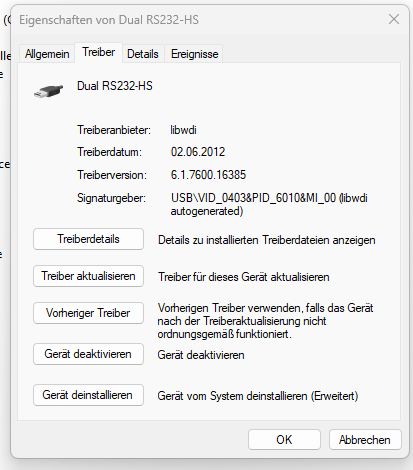
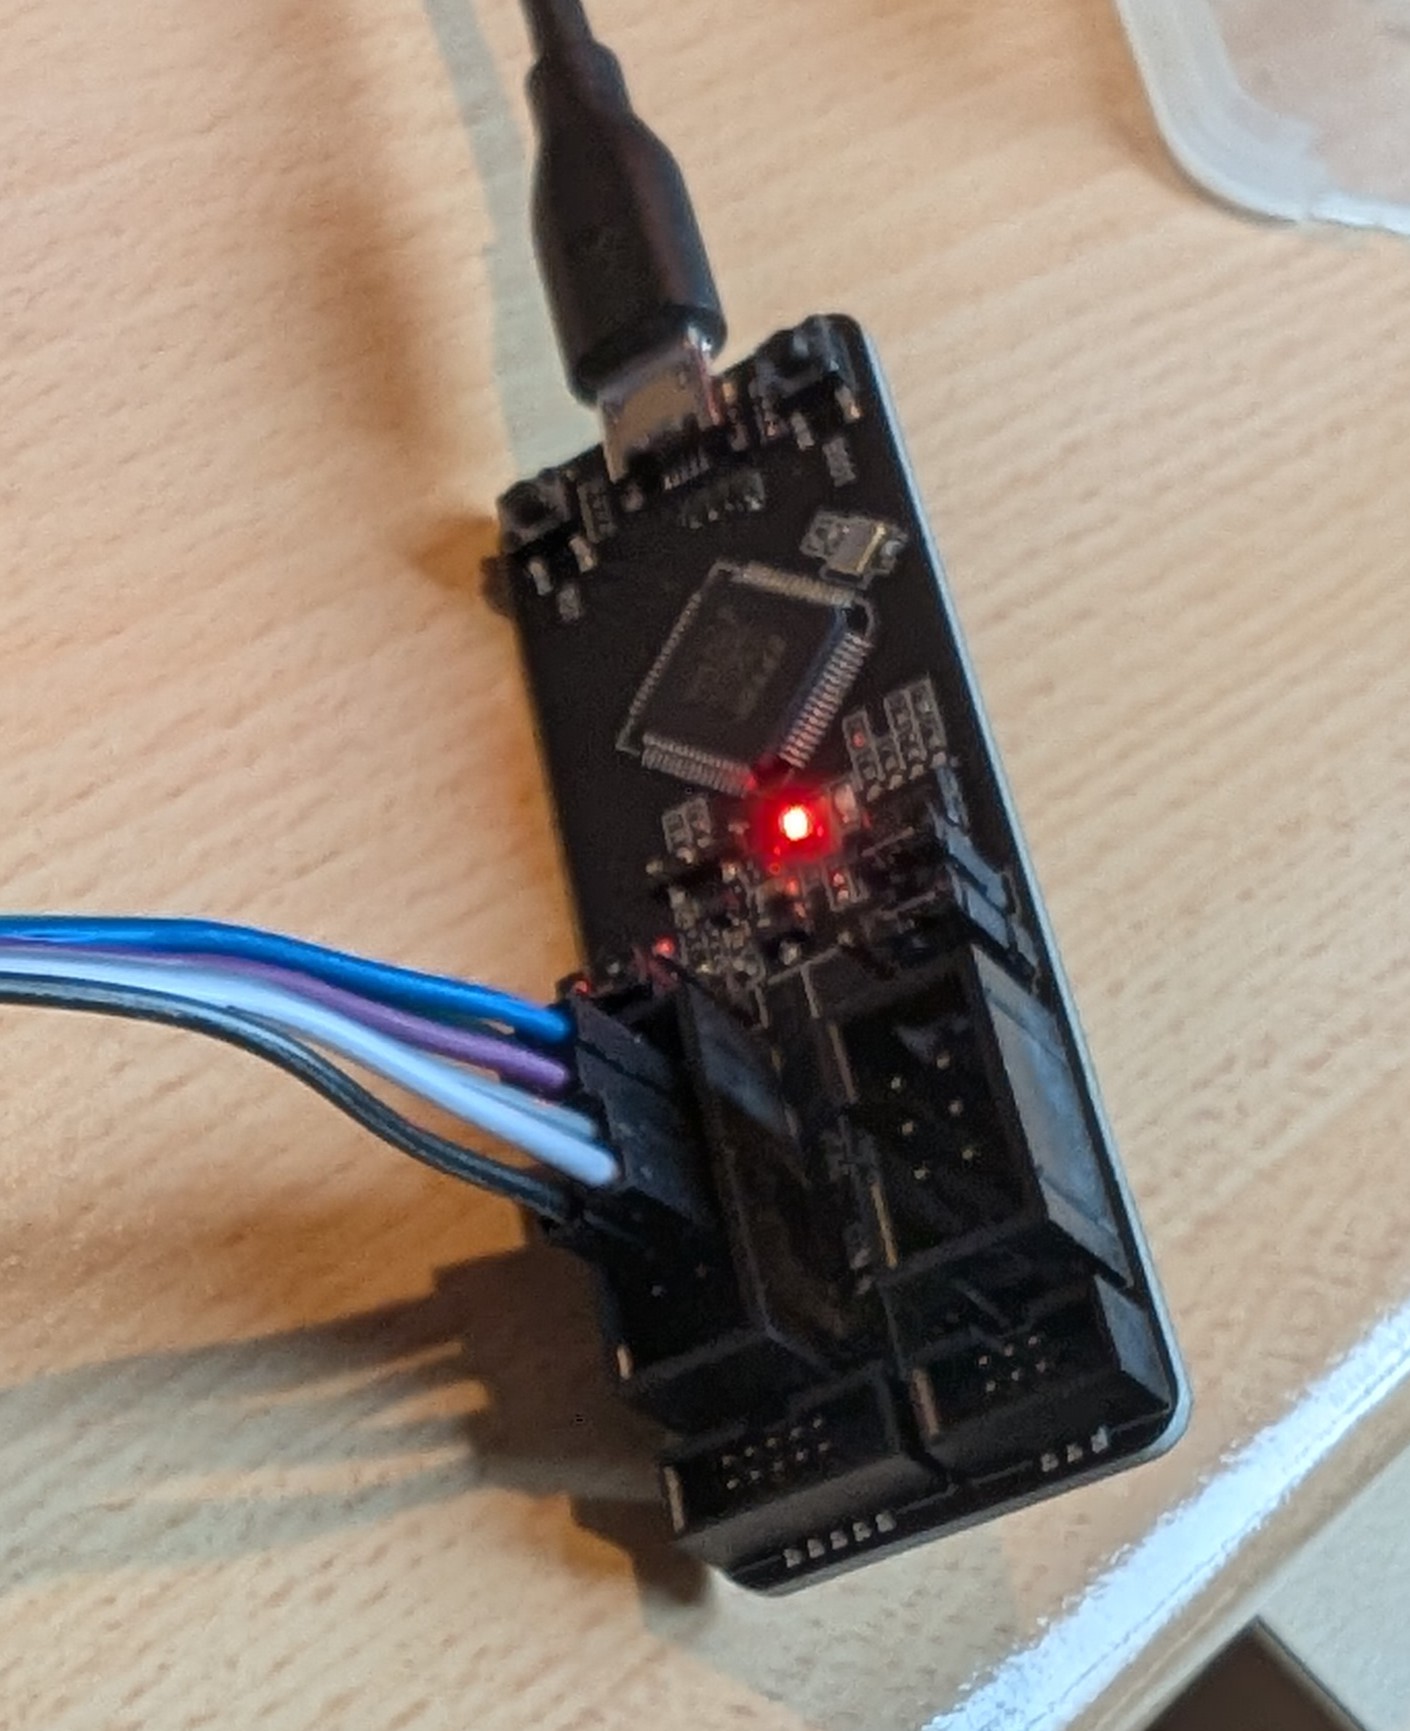
JTAG via esp-prog; driver installed from FTDI and ZADIG 2.9
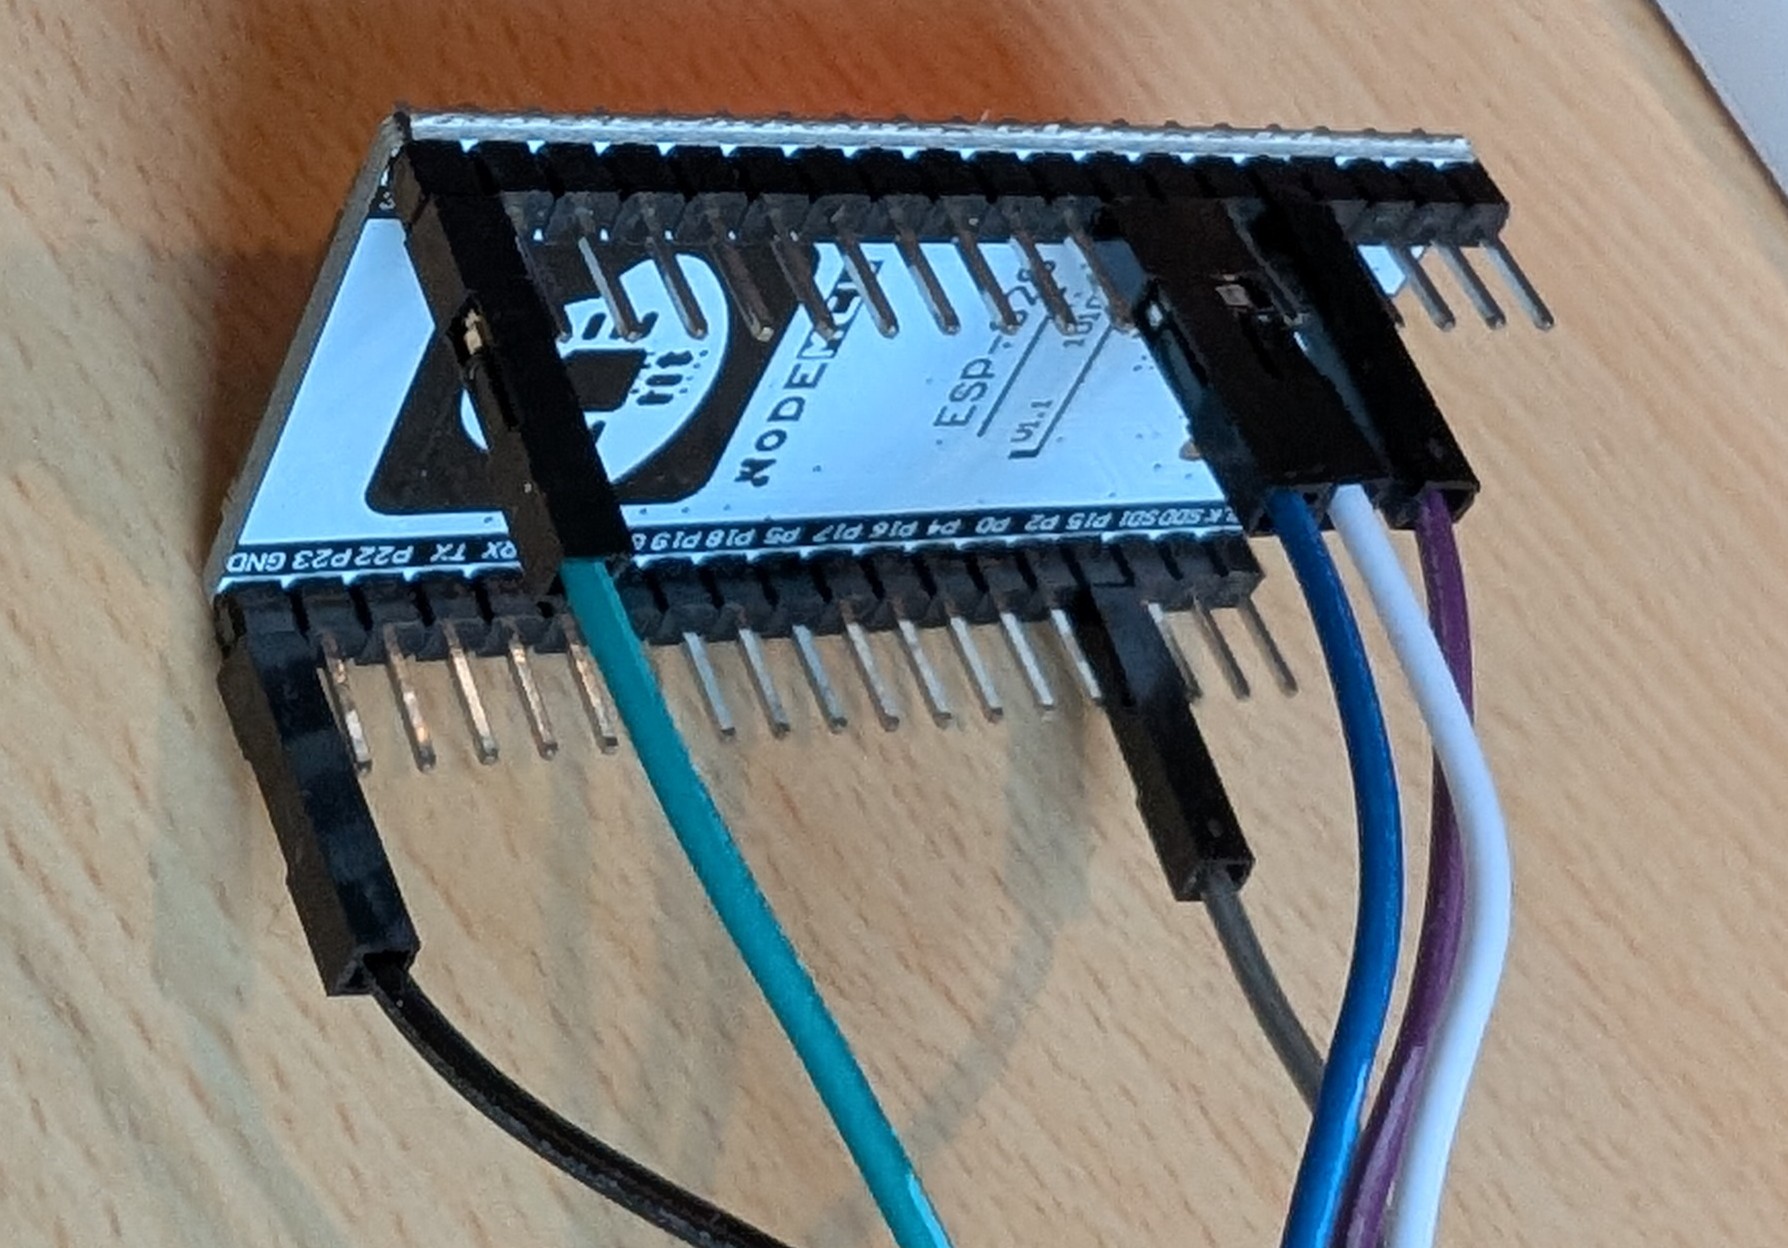
All the stuff on a breadboard with ~ 20cm cables.
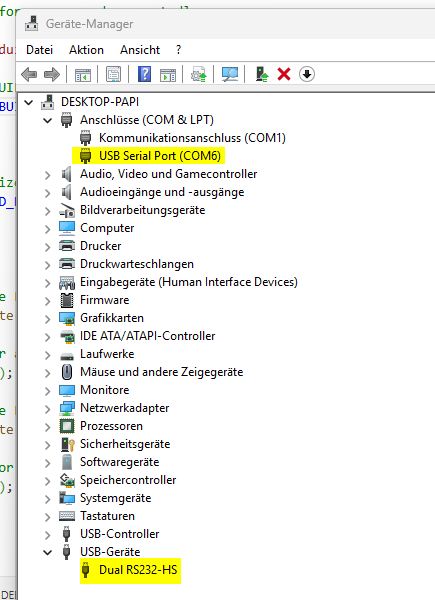
Installation was flawless, but I’m not able to start a debugging session. The drivers are visible in the device manager, nothing suspect. After days of finding a solution, I’m frustrated. The debuger claims not to find the esp-prog (vid 0403, pid 6010), but it is installed and several times unsinstalled and reinstalled. What is wrong here?
Any help is highly appreciated…
Here the dubugger console output:
Reading symbols from D:\Dokumente\PlatformIO\Projects\MyBlinky\.pio\build\freenove_esp32_wrover\firmware.elf...
PlatformIO Unified Debugger -> https://bit.ly/pio-debug
PlatformIO: debug_tool = esp-prog
PlatformIO: Initializing remote target...
Open On-Chip Debugger v0.11.0-esp32-20220706 (2022-07-06-15:48)
Licensed under GNU GPL v2
For bug reports, read
http://openocd.org/doc/doxygen/bugs.html
adapter speed: 20000 kHz
WARNING: boards/esp32-wrover.cfg is deprecated, and may be removed in a future release.
If your board is ESP32-WROVER-KIT, use board/esp32-wrover-kit-1.8v.cfg instead.
adapter speed: 500 kHz
Info : tcl server disabled
Info : telnet server disabled
Error: no device found
Error: unable to open ftdi device with vid 0403, pid 6010, description '*', serial '*' at bus location '*'
Error: no device found
Error: unable to open ftdi device with vid 0403, pid 6014, description '*', serial '*' at bus location '*'
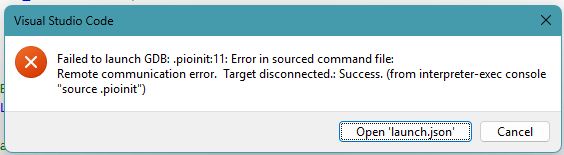
.pioinit:11: Error in sourced command file:
Remote communication error. Target disconnected.: Success.
Okay. Post a screenshot of Zadig with the esp-prog device selected (Dual RS232-HS (Interface 0) ) that shows you have loaded WInUSB drivers, per source.
undefined C:\Users\……\.platformio\packages\toolchain-xtensa-esp32\bin\xtensa-esp32-elf-gdb.exe: warning: Couldn’t determine a path for the index cache directory.
That should not happen. Maybe something is interfering on your Windows system.
Use a virtual machine (e.g. VirutalBox or VMWare), install a standard Ubuntu in it, install VSCode and PlatformIO in it, recreate the project, forward the esp-prog USB device into the virtual machine and try again.
I created a new user (named ESP) and installed all packages from the scratch. After that I’m still not able to start the debugger, I’m slowly going crazy when I can’t continue working.
@maxgerhardt is there any web page which leads me through the VirtualBox stuff etc. ?
I changed my Window SSD with a brand new one and installed Win11 from the scratch. A complete clean new installation. AT the moment, I have only firefox, Thunderbird and VSCode with PlatformIO installed. Nothing else!!!
What I tested until today:
3 different ESP32 modules from different vendors
2 ESP-PROG modules
and finally a new windows setup
That’s the disappointing result. I’m now at the end of my knowledge. Seems the ESP32 platform is not usable for me
undefinedC:\Users\xxxxx\.platformio\packages\toolchain-xtensa-esp32\bin\xtensa-esp32-elf-gdb.exe: warning: Couldn't determine a path for the index cache directory.
Reading symbols from C:\Users\xxxxx\Documents\PlatformIO\Projects\Test\.pio\build\esp32dev\firmware.elf...
PlatformIO Unified Debugger -> https://bit.ly/pio-debug
PlatformIO: debug_tool = esp-prog
PlatformIO: Initializing remote target...
Open On-Chip Debugger v0.11.0-esp32-20220706 (2022-07-06-15:48)
Licensed under GNU GPL v2
For bug reports, read
http://openocd.org/doc/doxygen/bugs.html
adapter speed: 20000 kHz
WARNING: boards/esp-wroom-32.cfg is deprecated, and may be removed in a future release.
adapter speed: 5000 kHz
Info : tcl server disabled
Info : telnet server disabled
Error: libusb_open() failed with LIBUSB_ERROR_NOT_SUPPORTED
Info : clock speed 5000 kHz
Error: JTAG scan chain interrogation failed: all ones
Error: Check JTAG interface, timings, target power, etc.
Error: Trying to use configured scan chain anyway...
Error: esp32.cpu0: IR capture error; saw 0x1f not 0x01
Warn : Bypassing JTAG setup events due to errors
Error: Unexpected OCD_ID = ffffffff
Warn : target esp32.cpu0 examination failed
Error: Unexpected OCD_ID = ffffffff
Warn : target esp32.cpu1 examination failed
Info : starting gdb server for esp32.cpu0 on pipe
Info : accepting 'gdb' connection from pipe
Error: Target not examined yet
Error executing event gdb-attach on target esp32.cpu0:
Warn : No symbols for FreeRTOS!
Error: Target not halted
Error: auto_probe failed
Error: Connect failed. Consider setting up a gdb-attach event for the target to prepare target for GDB connect, or use 'gdb_memory_map disable'.
Error: attempted 'gdb' connection rejected
Error: error during select: Unknown error
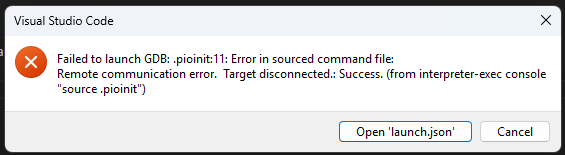
.pioinit:11: Error in sourced command file:
Remote communication error. Target disconnected.: Success.
This is actually very good. It has successfully connected to the FTDI using the right driver, but the connection between the FTDI (espprog) and the ESP32 fails. Usually this error message means:
a cable is not correctly connected
a cable is too long and the debug_speed is too high. Try debug_speed = 500 in your platformio.ini for a slower speed of 500 kHz.
you are using one of the JTAG pins as GPIO in your sketch (e.g., to blink an LED)
I reinstalled win11 again on a new SSD and insatlled VSCode, and PlatformIO.
Installed original FTDI driver from the FTDI website, and changed RS232 interface 0 to Zadig driver.
Used this platformio.ini:
; PlatformIO Project Configuration File
;
;   Build options: build flags, source filter
;   Upload options: custom upload port, speed and extra flags
;   Library options: dependencies, extra library storages
;   Advanced options: extra scripting
;
; Please visit documentation for the other options and examples
; https://docs.platformio.org/page/projectconf.html

[env:esp32dev]
platform = espressif32
board = esp32dev
framework = arduino

debug_tool = esp-prog
debug_init_break = tbreak setup
debug_speed = 100
The source:
#include <Arduino.h>

// put function declarations here:
int myFunction(int, int);

void setup() {
  // put your setup code here, to run once:
  int result = myFunction(2, 3);
}

void loop() {
  // put your main code here, to run repeatedly:
}

// put function definitions here:
int myFunction(int x, int y) {
  return x + y;
}
undefinedC:\Users\xxxxxxx\.platformio\packages\toolchain-xtensa-esp32\bin\xtensa-esp32-elf-gdb.exe: warning: Couldn't determine a path for the index cache directory.

Reading symbols from C:\Users\xxxxxx\Documents\PlatformIO\Projects\Test\.pio\build\esp32dev\firmware.elf...
PlatformIO Unified Debugger -> https://bit.ly/pio-debug
PlatformIO: debug_tool = esp-prog
PlatformIO: Initializing remote target...
Open On-Chip Debugger  v0.11.0-esp32-20220706 (2022-07-06-15:48)
Licensed under GNU GPL v2
For bug reports, read
	http://openocd.org/doc/doxygen/bugs.html
adapter speed: 20000 kHz

WARNING: boards/esp-wroom-32.cfg is deprecated, and may be removed in a future release.
adapter speed: 100 kHz

Info : tcl server disabled
Info : telnet server disabled
Error: libusb_open() failed with LIBUSB_ERROR_NOT_SUPPORTED
Info : clock speed 100 kHz
Error: JTAG scan chain interrogation failed: all ones
Error: Check JTAG interface, timings, target power, etc.
Error: Trying to use configured scan chain anyway...
Error: esp32.cpu0: IR capture error; saw 0x1f not 0x01
Warn : Bypassing JTAG setup events due to errors
Error: Unexpected OCD_ID = ffffffff
Warn : target esp32.cpu0 examination failed
Error: Unexpected OCD_ID = ffffffff
Warn : target esp32.cpu1 examination failed
Info : starting gdb server for esp32.cpu0 on pipe
Info : accepting 'gdb' connection from pipe
Error: Target not examined yet
Error executing event gdb-attach on target esp32.cpu0:

Warn : No symbols for FreeRTOS!
Error: Target not halted
Error: auto_probe failed
Error: Connect failed. Consider setting up a gdb-attach event for the target to prepare target for GDB connect, or use 'gdb_memory_map disable'.
Error: attempted 'gdb' connection rejected
Error: error during select: Unknown error
.pioinit:11: Error in sourced command file:
Remote communication error.  Target disconnected.: Success.