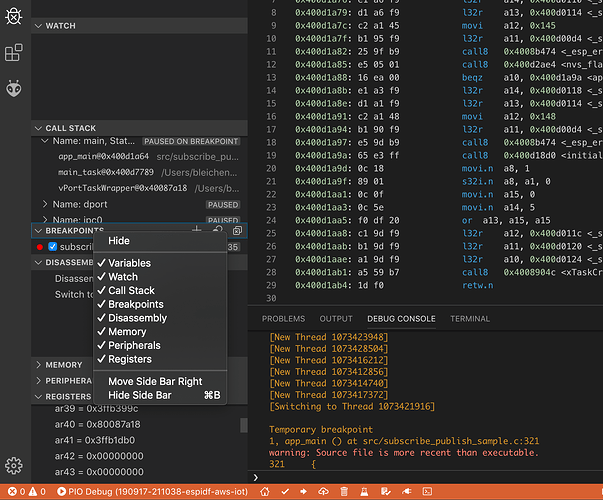
The PIO unified debugger as presented on Debugging — PlatformIO latest documentation looks very promising especially the extra debugger views like registers and disassembly. This page also notes that the PIO unified debugger is integrated into PlatformIo IDE for VSCode, so I guess there are no extra installation steps to get started.
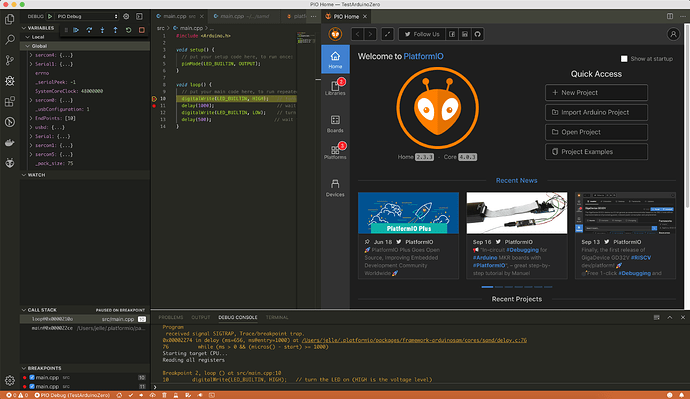
However after I installed PIO IDE as an extension of VSCode I can’t see these extra views. How can I enable them? Note that I can use the debugger and step through the code with the help of a jLink debugging probe, I just can’t see / find the registers and disassembly views.
This is what my current setup looks like
OS: osx 10.14.6
VSCode: v1.38.1
PIO home: 2.3.3
PIO core: 4.0.3
Any hints what I’m missing?


