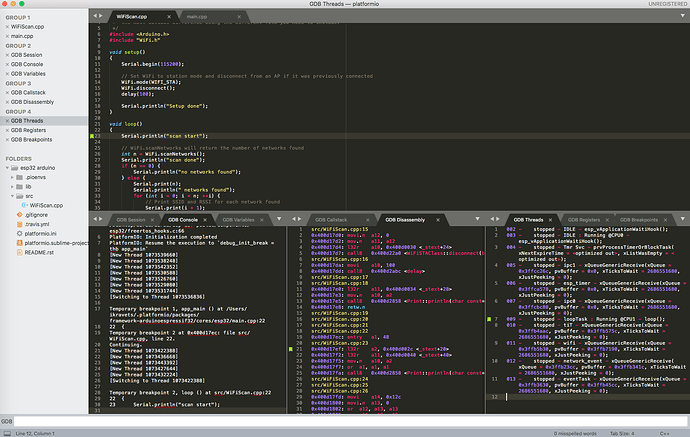
Hello,
I am unable to use the platformio unified debugger with sublime text…
I used the debugger feature with atom and vscode successfully.
I changed my IDE recently to sublime and I am unable to use the debugging feature.
Sublimegdb is installed.
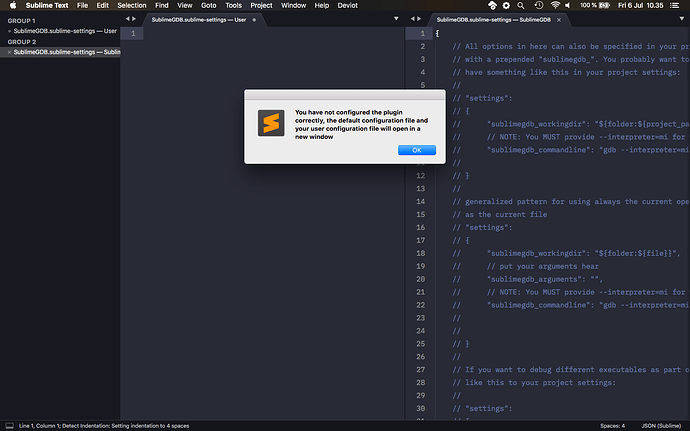
I run the debug command and I get this error
irrespective of the different boards I try with…
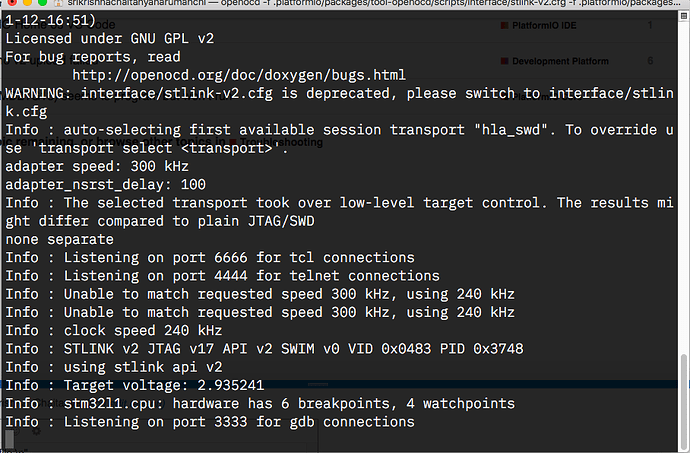
I tried with 3-4 different stm32 discovery boards and I get the same issue every time.
These are the sublimegdb specific settings in the pio generated platformio.sublime-project.
   "settings":
    {
         "sublimegdb_workingdir": "/Users/srikrishnachaitanyanarumanchi/Documents/PlatformIO/Projects/disco_f030r8",
         "sublimegdb_exec_cmd": "-exec-continue",
         "sublimegdb_commandline": "/Users/srikrishnachaitanyanarumanchi/.platformio/penv/bin/platformio -f -c sublimetext debug --interface=gdb --interpreter=mi -x .pioinit"

    }
and this is the sublimegdb settings file
{
// All options in here can also be specified in your project settings
// with a prepended “sublimegdb_”. You probably want to
// have something like this in your project settings:
//
// “settings”:
// {
// “sublimegdb_workingdir”: “${folder:${project_path:your_executable_name}}”,
// // NOTE: You MUST provide --interpreter=mi for the plugin to work
// “sublimegdb_commandline”: “gdb --interpreter=mi ./your_executable_name”
//
// }
//
// generalized pattern for using always the current open file with an executable name
// as the current file
// “settings”:
// {
// “sublimegdb_workingdir”: “${folder:${file}}”,
// // put your arguments hear
// “sublimegdb_arguments”: “”,
// // NOTE: You MUST provide --interpreter=mi for the plugin to work
// “sublimegdb_commandline”: “gdb --interpreter=mi --args ./${file_base_name}”
//
//
// }
//
// If you want to debug different executables as part of the same project, you can add something
// like this to your project settings:
//
// “settings”:
// {
// “sublimegdb_executables”:
// {
// “first_executable_name”:
// {
// “workingdir”: “${folder:${project_path:first_executable_name}}”,
// “commandline”: “gdb --interpreter=mi ./first_executable”
// },
// “second_executable_name”:
// {
// “workingdir”: “${folder:${project_path:second_executable_name}}”,
// “commandline”: “gdb --interpreter=mi ./second_executable”
// }
// }
// }
//
// When you start debugging, you will be prompted to choose from one of your executables. Any
// settings not specified for that project will be searched in your project settings (with a
// sublimegdb_ prefix), then in your user settings, then in the default settings.
//
// (Note: if you have multiple executables, and you have a breakpoint set in a source file which
// is not included in the current executable, you may have to set either debug_ext or
// i_know_how_to_use_gdb_thank_you_very_much.)
//
// ${home}, ${project_path:}, ${folder:}, ${file} and ${file_base_name}
// tokens can be used in ‘workingdir’, ‘commandline’, ‘arguments’ options.
//
// ${home} is replaced with the value of the HOME environment variable.
//
// ${project_path:} tries to find a file with the given name in all the registered project folders and
// returns the first file found, or the original file name if none is found.
// Example: ${project_path:main.cpp} tries to find a file named “main.cpp” relative
// to the current project’s folders. If none is found, it is replaced with “main.cpp”.
//
// ${folder:} is replaced with the dirname of the given path.
// Example: ${folder:/path/to/file} is replaced with “/path/to”.
// “workingdir”: “/tmp”,
//
// ${file} is replaced with absolute path to currently open file (if any)
// Example: /home/user/main.cpp
//
// ${file_base_name} is replaced with name without extension of currently
// open file (if any)
// Example: replaced with “main” for file “/home/user/main.cpp”
“workingdir”: “notset”,// NOTE: You MUST provide --interpreter=mi for the plugin to work // "commandline": "gdb --interpreter=mi ./executable", "commandline": "notset", // Environments for running gdb and gdb server // Example: "env": {"DISPLAY": ":100"} "env": "notset", // Arguments for the program. // Example: to run "./executable foo bar" // "arguments": "foo bar" // To provide user input (stdin) use // "arguments": "< input.dat" "arguments": "", // GDB Server // Specify a command and working dir for launching a GDB Server // This is useful for dealing with "remote" servers that are actually locally // connected JTAG boxes "server_workingdir": "notset", "server_commandline": "notset", // The command to use to run the program. // If you are attaching to a remote program, you // probably want to change this to -exec-continue "exec_cmd": "-exec-run", // Load the image to the remote target "load_cmd": "-target-download", // Immediately run the target upload connecting // When attaching to a remote program, you // may want to set this to false "run_after_init": true, // Attempt to update stack information while the program is running // If your remote target does not support non-stop, set this to false "update_while_running" : true, // Attach to a remote target? This is needed here because "-gdb-set target-async 1" must be // done prior to attaching "attach_cmd" : "notset", // For the larger binaries with lot of shared libraries // the loading within the gdb could take much longer. // Configure the thread wait timeout by setting gdb_timeout "gdb_timeout": 60, // Define debugging window layout (window split) // first define column/row separators, then refer to them to define cells "layout": { "cols": [0.0, 0.33, 0.66, 1.0], "rows": [0.0, 0.75, 1.0], "cells": [ // c1 r1 c2 r2 [0, 0, 3, 1], // -> (0.00, 0.00), (1.00, 0.75) [0, 1, 1, 2], // -> (0.00, 0.75), (0.33, 1.00) [1, 1, 2, 2], // -> (0.33, 0.75), (0.66, 1.00) [2, 1, 3, 2] // -> (0.66, 0.75), (1.00, 1.00) ] }, // visual stuff "breakpoint_scope": "keyword.gdb", "breakpoint_icon": "circle", "position_scope": "entity.name.class", "position_icon": "bookmark", "changed_variable_scope": "entity.name.class", "changed_variable_icon": "", // The group used for opening files "file_group": 0, "session_group": 1, "session_open": true, "console_group": 1, "console_open": true, "variables_group": 1, "variables_open": true, "callstack_group": 2, "callstack_open": true, "registers_group": 2, "registers_open": false, "disassembly_group": 2, "disassembly_open": false, // Set to "intel" for intel disassembly flavor. All other // values default to using "att" flavor. "disassembly_flavor": "intel", "threads_group": 3, "threads_open": true, "breakpoints_group": 3, "breakpoints_open": true, // If set to true will push the layout before debugging // and pop it when debugging ends "push_pop_layout": true, // If set to true will close the gdb views when the // debugging session ends "close_views": true, // File to optionally write all the raw data read from and written to the gdb session and the inferior program. // Setting it to "stdout" will write the output to the python console "debug_file": "stdout", // Add "pending breakpoints" for symbols that are dynamically loaded from // external shared libraries "debug_ext" : false, // Whether to log the raw data read from and written to the gdb session and the inferior program. "debug": true, // Disables showing the error message dialog when something goes wrong "i_know_how_to_use_gdb_thank_you_very_much": false}
Any ideas on what I am missing?? Did anyone else face this issue with sublime and pio??
Thanks in advance!! ![]()
