Hey folks! I built a small CLI tool that reads your platformio.ini and generates a Graphviz DOT graph of how your sections relate to each other via extends.
If your config has grown to the point where you can’t remember what extends what — this might help.
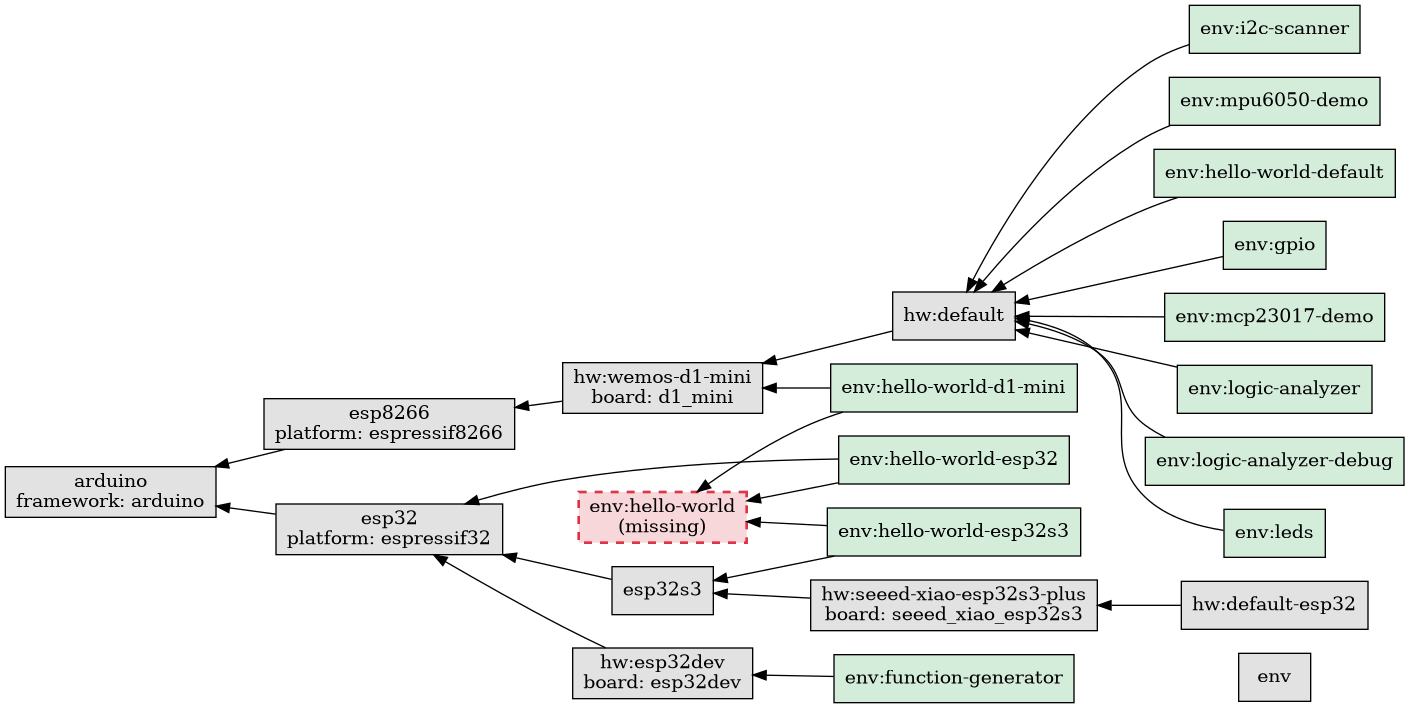
What it does:
- Parses
platformio.ini+extra_configs(including globs) - Shows
extendschains as a directed graph - Color-codes nodes: green for
[env:*], gray for shared sections, red for missing targets - Optionally shows
${section.key}references as dashed edges
Quick start:
pip install pio-env-graph
pio-env-graph | dot -Tpng -o graph.png
Here’s what the output looks like for one of my projects:
PyPI: pio-env-graph · PyPI
License: MIT
It’s still early days, so feedback and bug reports are welcome. Would love to hear if it’s useful for anyone else!