Need help with JTAG on ESP-WROVER-KIT-VE

Hi,

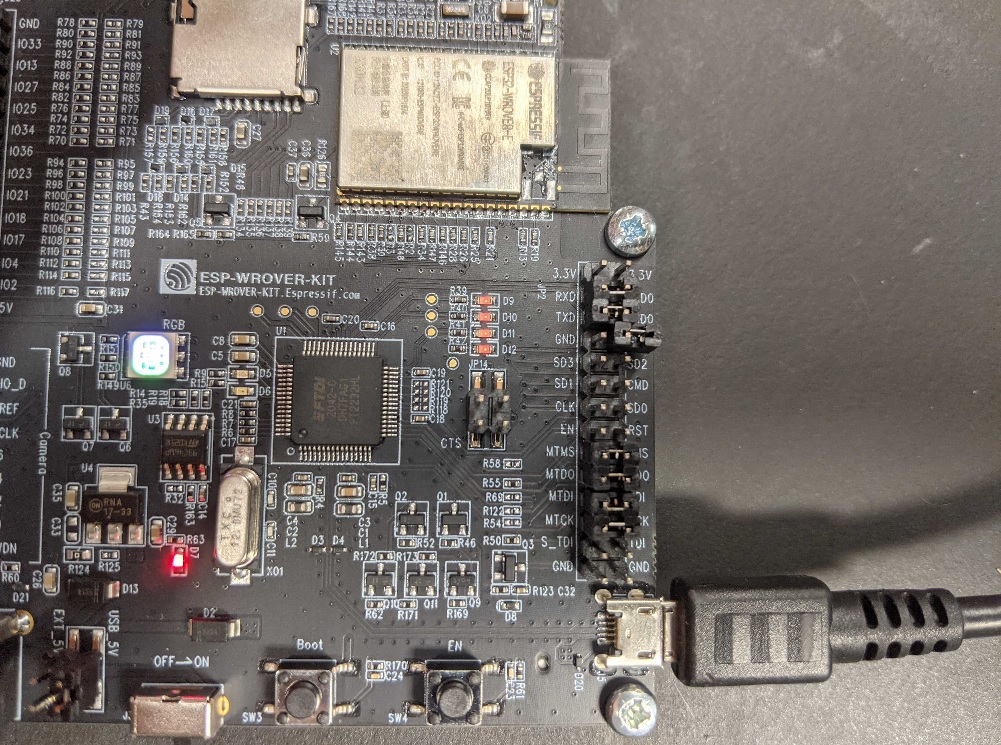
I try to use the JTAG debugger on my ESP-WROVER-KIT-VE in an Arduino and the esp-idf environment with Visual Studio Code. I wrote a small program to test the debugger:

static void applicationTask(void* p_Parameter)
{
    setup();
    while(true)
    {

        TIMERG0.wdt_wprotect = TIMG_WDT_WKEY_VALUE;
        TIMERG0.wdt_feed = 1;
        TIMERG0.wdt_wprotect = 0;
        micros();
        loop();
    }
}

static void StartApplication(void)
{
    initArduino();
    applicationHandle = xTaskCreateStaticPinnedToCore(applicationTask, "applicationTask", CONFIG_ARDUINO_LOOP_STACK_SIZE, NULL, 1, applicationStack, &applicationBuffer, CONFIG_ARDUINO_RUNNING_CORE);
    if(applicationHandle == NULL)
    {
    }
}

extern "C" void app_main(void)
{
    StartApplication();
}

#include <Arduino.h>

void setup(void)
{
    Serial.begin(115200);
}

void loop(void)
{
    Serial.print("Hello\n\r");
    delay(1000);
}

And my configuration file:

[platformio]
src_dir = src

[env]
board = esp-wrover-kit

platform = espressif32@1.12.4
framework = arduino, espidf

board_upload.flash_size = 4MB
board_upload.maximum_size = 4194304
board_build.partitions = other/partitions.csv

upload_speed = 921600
upload_port = COM6

monitor_speed = 115200
monitor_port = COM6
monitor_filters = esp32_exception_decoder

debug_tool = ftdi
debug_init_break = tbreak app_main

platform_packages =
    framework-arduinoespressif32 @ https://github.com/marcovannoord/arduino-esp32.git#idf-release/v4.0
    toolchain-xtensa32@3.80200.200512

[common]
build_flags =

    # ESP32 specific
    -D ARDUINO_ESP32_DEV
    -D BOARD_HAS_PSRAM
    -mfix-esp32-psram-cache-issue

lib_deps_builtin =

lib_deps_external =

[env:debug]
build_type = debug
build_flags =
    ${common.build_flags}
    -D DEBUG
lib_deps =
    ${common.lib_deps_builtin}
    ${common.lib_deps_external}

The code is working on the development board, but the debugger doesn´t start. I´m clicking on PIO Debug inside of the debug menu and I got the following output:

Processing debug (board: esp-wrover-kit; platform: espressif32@1.12.4; framework: arduino, espidf)
-----------------------------------------------------------------------------------------------------------------------------------------------------------------------------------Verbose mode can be enabled via `-v, --verbose` option
CONFIGURATION: https://docs.platformio.org/page/boards/espressif32/esp-wrover-kit.html
PLATFORM: Espressif 32 (1.12.4) > Espressif ESP-WROVER-KIT
HARDWARE: ESP32 240MHz, 320KB RAM, 4MB Flash
DEBUG: Current (ftdi) On-board (ftdi) External (esp-prog, iot-bus-jtag, jlink, minimodule, olimex-arm-usb-ocd, olimex-arm-usb-ocd-h, olimex-arm-usb-tiny-h, olimex-jtag-tiny, tumpa)
PACKAGES:
 - framework-arduinoespressif32 0.0.0+sha.d011dd7
 - framework-espidf 3.40001.200521 (4.0.1)
 - tool-cmake 3.16.4
 - tool-esptoolpy 1.20600.0 (2.6.0)
 - tool-idf 1.0.1
 - tool-mconf 1.4060000.20190628 (406.0.0)
 - tool-ninja 1.9.0
 - toolchain-esp32ulp 1.22851.191205 (2.28.51)
 - toolchain-xtensa32 3.80200.200512 (8.2.0)
Reading CMake configuration...
LDF: Library Dependency Finder -> http://bit.ly/configure-pio-ldf
LDF Modes: Finder ~ chain, Compatibility ~ soft
Found 2 compatible libraries
Scanning dependencies...
Dependency Graph
Building in debug mode
Retrieving maximum program size .pio\build\debug\firmware.elf
Checking size .pio\build\debug\firmware.elf
Advanced Memory Usage is available via "PlatformIO Home > Project Inspect"
RAM:   [=         ]   6.6% (used 21656 bytes from 327680 bytes)
Flash: [=         ]   7.4% (used 194487 bytes from 2621440 bytes)

Sometimes the debugger starts and throws this error:

For bug reports, read
http://openocd.org/doc/doxygen/bugs.html
none separat
adapter speed: 20000 kHz
Info : Configured 2 cores
esp32 interrupt mask on
Info : tcl server disabled
Info : telnet server disabled
Info : ftdi: if you experience problems at higher adapter clocks, try the command "ftdi_tdo_sample_edge falling"
Info : clock speed 20000 kHz
Error: JTAG scan chain interrogation failed: all ones
Error: Check JTAG interface, timings, target power, etc.
Error: Trying to use configured scan chain anyway...
Error: esp32.cpu0: IR capture error; saw 0x1f not 0x01

What is wrong here?

This is a strong indication, that the connection between the debugger and the ESP32 is not working.

Please provide details how you connected all the components and what kind of debugger you are using.

Hi,

I placed the jumpers according to this guide.

Try connecting the EN - RST jumper above MTMS too per schematics that goes nTRST (JTAG reset signal).

20 MHz might be too fast for the board. Try setting e.g. debug_speed = 2000 for 2MHz, or even lower.

Hi,

I have changed the debug speed to 2 MHz and set a jumper between EN and RSR. I got the following output now:

Info : Using flash size 108 KB
Info : Target halted. PRO_CPU: PC=0x400916EE (active) APP_CPU: PC=0x400EA72A
Info : Flash mapping 0: 0x10020 -> 0x3f400020, 23 KB
Info : Flash mapping 1: 0x20018 -> 0x400d0018, 105 KB
Info : Using flash size 24 KB
0x400ea72a in esp_pm_impl_waiti () at C:\.platformio\packages\framework-espidf\components\esp32\pm_esp32.c:484
484 asm("waiti 0");
Loading section .dram0.data, size 0x2138 lma 0x3ffbdb60
Loading section .iram0.vectors, size 0x400 lma 0x40080000
Loading section .iram0.text, size 0xcbfe lma 0x40080400
Info : JTAG tap: esp32.cpu0 tap/device found: 0x120034e5 (mfg: 0x272 (Tensilica), part: 0x2003, ver: 0x1)
Info : JTAG tap: esp32.cpu1 tap/device found: 0x120034e5 (mfg: 0x272 (Tensilica), part: 0x2003, ver: 0x1)
Error: cpu0: xtensa_write_memory (line 807): DSR (FFFFFFFF) indicates target still busy!
Error: cpu0: xtensa_write_memory (line 807): DSR (FFFFFFFF) indicates DIR instruction generated an exception!
Error: cpu0: xtensa_write_memory (line 807): DSR (FFFFFFFF) indicates DIR instruction generated an overrun!
Warn : keep_alive() was not invoked in the 1000ms timelimit. GDB alive packet not sent! (1001). Workaround: increase "set remotetimeout" in GDB
Warn : esp32: Failed writing 4 bytes at address 0x3ff48000, data - 00, 20, 49, 9c, 4c, 00, 00, 00
Error: xtensa_write_uint32_list: error writing to 3ff48000
Warn : esp32_soc_reset xtensa_write_uint32_list (reg_value_pairs_pre) err=-4
4
Warn : keep_alive() was not invoked in the 1000ms timelimit. GDB alive packet not sent! (1003). Workaround: increase "set remotetimeout" in GDB
Error: cpu0: xtensa_read_memory (line 700): DSR (FFFFFFFF) indicates target still busy!
Error: cpu0: xtensa_read_memory (line 700): DSR (FFFFFFFF) indicates DIR instruction generated an exception!
Error: cpu0: xtensa_read_memory (line 700): DSR (FFFFFFFF) indicates DIR instruction generated an overrun!
Warn : cpu0: Failed reading 5848 bytes at address 0x40090000
Error: no working area available, can't alloc space for stub code!
Error: Failed to load stub (-308)!
Error: Algorithm run failed (-308)!
Error: Failed to run flasher stub (-308)!
Error: failed erasing sectors 0 to 5
Error: flash_erase returned -308
.pioinit:12: Error in sourced command file:
Error erasing flash with vFlashErase packet

Okay so that’s better than it not finding anything before… but now the target is held in reset. Can you remove the EN-RST jumper again and retry?

I have removed the bridge between EN and RST and got this output.

Open On-Chip Debugger v0.10.0-esp32-20190708 (2019-07-08-11:04)
Licensed under GNU GPL v2
For bug reports, read
http://openocd.org/doc/doxygen/bugs.html
none separate
adapter speed: 20000 kHz
Info : Configured 2 cores
esp32 interrupt mask on
Info : tcl server disabled
Info : telnet server disabled
Info : ftdi: if you experience problems at higher adapter clocks, try the command "ftdi_tdo_sample_edge falling"
Info : clock speed 20000 kHz
Error: JTAG scan chain interrogation failed: all ones
Error: Check JTAG interface, timings, target power, etc.
Error: Trying to use configured scan chain anyway...
Error: esp32.cpu0: IR capture error; saw 0x1f not 0x01
Warn : Bypassing JTAG setup events due to errors
Info : accepting 'gdb' connection from pipe
Error: No symbols for FreeRTOS
Error: Target not examined yet
2
Error: Target not halted
Error: auto_probe failed
Error: Connect failed. Consider setting up a gdb-attach event for the target to prepare target for GDB connect, or use 'gdb_memory_map disable'.
Error: attempted 'gdb' connection rejected
Error: error during select: Unknown error
Warn : Flash driver of esp32.flash does not support free_driver_priv()
Warn : Flash driver of irom does not support free_driver_priv()
Warn : Flash driver of drom does not support free_driver_priv()
.pioinit:11: Error in sourced command file:
Remote communication error. Target disconnected.: Success

Hm. Try putting the EN-RST jumper again and lowering the debug_speed even more – this is at least what the docs say regarding DSR (FFFFFFFF) indicates target still busy errors.

Hi,

I have set the debug speed to 1 MHz, but the problem still exists.

Loading section .iram0.text, size 0xcbff lma 0x40080400
Info : JTAG tap: esp32.cpu0 tap/device found: 0x120034e5 (mfg: 0x272 (Tensilica), part: 0x2003, ver: 0x1)
Info : JTAG tap: esp32.cpu1 tap/device found: 0x120034e5 (mfg: 0x272 (Tensilica), part: 0x2003, ver: 0x1)
Error: cpu0: xtensa_write_memory (line 807): DSR (FFFFFFFF) indicates target still busy!
Error: cpu0: xtensa_write_memory (line 807): DSR (FFFFFFFF) indicates DIR instruction generated an exception!
Error: cpu0: xtensa_write_memory (line 807): DSR (FFFFFFFF) indicates DIR instruction generated an overrun!
Warn : keep_alive() was not invoked in the 1000ms timelimit. GDB alive packet not sent! (1015). Workaround: increase "set remotetimeout" in GDB
Warn : esp32: Failed writing 4 bytes at address 0x3ff48000, data - 00, 20, 49, 9c, 4c, 00, 00, 00
Error: xtensa_write_uint32_list: error writing to 3ff48000
Warn : esp32_soc_reset xtensa_write_uint32_list (reg_value_pairs_pre) err=-4
4
Warn : keep_alive() was not invoked in the 1000ms timelimit. GDB alive packet not sent! (1007). Workaround: increase "set remotetimeout" in GDB
Error: cpu0: xtensa_read_memory (line 700): DSR (FFFFFFFF) indicates target still busy!
Error: cpu0: xtensa_read_memory (line 700): DSR (FFFFFFFF) indicates DIR instruction generated an exception!
Error: cpu0: xtensa_read_memory (line 700): DSR (FFFFFFFF) indicates DIR instruction generated an overrun!
Warn : keep_alive() was not invoked in the 1000ms timelimit. GDB alive packet not sent! (1003). Workaround: increase "set remotetimeout" in GDB
Warn : cpu0: Failed reading 5848 bytes at address 0x40090000
Error: no working area available, can't alloc space for stub code!
Error: Failed to load stub (-308)!
Error: Algorithm run failed (-308)!
Error: Failed to run flasher stub (-308)!
Error: failed erasing sectors 0 to 5
Error: flash_erase returned -308
.pioinit:12: Error in sourced command file:
Error erasing flash with vFlashErase packet
.pioinit:12: Error in sourced command file: Error erasing flash with vFlashErase packet

To make it clear:

Do I have to put the device into bootloader mode to use the JTAG mode or can I enable the JTAG all the time?

No need to put the device into bootloader mode, this should work. Given you’re not using any of the JTAG pins during runtime.

You can try debug_speed = 500 as a final try, but if that does not work, no idea. Try asking on the ESP32 forums then or in espressif/openocd-esp32.

Are you testing this with a simple blink program or with a complex program?

JTAG uses GPIO12 trough GPIO15. So if they are used for something else, JTAG will not work. JTAG doesn’t work either if the deep sleep is used.

Hi,

I use the program from my first post. This program doesn´t use the JTAG pins or the sleep mode.