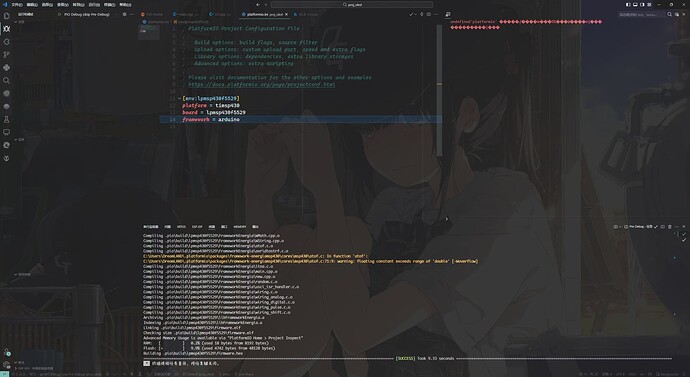
Hi, everyone. I have got a board named MSP430F5529 LaunchPad Evaluation Kit and i want to use platformIO to write C code.I create a project:
[env:lpmsp430f5529]
platform = timsp430
board = lpmsp430f5529
framework = arduino
and platformIO create a launch.json for me:
// AUTOMATICALLY GENERATED FILE. PLEASE DO NOT MODIFY IT MANUALLY
//
// PlatformIO Debugging Solution
//
// Documentation: https://docs.platformio.org/en/latest/plus/debugging.html
// Configuration: https://docs.platformio.org/en/latest/projectconf/sections/env/options/debug/index.html

{
    "version": "0.2.0",
    "configurations": [
        {
            "type": "platformio-debug",
            "request": "launch",
            "name": "PIO Debug",
            "executable": "d:/Docs/PlatformIO/Projects/proj_1/.pio/build/lpmsp430f5529/firmware.elf",
            "projectEnvName": "lpmsp430f5529",
            "toolchainBinDir": "C:/Users/DreamLAND/.platformio/packages/toolchain-timsp430/bin",
            "internalConsoleOptions": "openOnSessionStart",
            "preLaunchTask": {
                "type": "PlatformIO",
                "task": "Pre-Debug"
            }
        },
        {
            "type": "platformio-debug",
            "request": "launch",
            "name": "PIO Debug (skip Pre-Debug)",
            "executable": "d:/Docs/PlatformIO/Projects/proj_1/.pio/build/lpmsp430f5529/firmware.elf",
            "projectEnvName": "lpmsp430f5529",
            "toolchainBinDir": "C:/Users/DreamLAND/.platformio/packages/toolchain-timsp430/bin",
            "internalConsoleOptions": "openOnSessionStart"
        },
        {
            "type": "platformio-debug",
            "request": "launch",
            "name": "PIO Debug (without uploading)",
            "executable": "d:/Docs/PlatformIO/Projects/proj_1/.pio/build/lpmsp430f5529/firmware.elf",
            "projectEnvName": "lpmsp430f5529",
            "toolchainBinDir": "C:/Users/DreamLAND/.platformio/packages/toolchain-timsp430/bin",
            "internalConsoleOptions": "openOnSessionStart",
            "loadMode": "manual"
        }
    ]
}
i have checked the path of executable, it is right. I can build the project successfully. But when I want to launch a debug, I can’t get any output in the terminal. It just stopped in a moment. I don’t know how to deal with it.
Open a PlatformIO CLI and execute
pio debug --interface=gdb -- -x .pioinit
what’s the output?
hello, i have got the output just like this.
It seems like the correct situation?
There’s quite a few hits for --allow-fw-update in
https://github.com/platformio/platform-timsp430/issues?q=is%3Aissue+"--allow-fw-update"
With an explicit solution in https://github.com/platformio/platform-timsp430/issues/9 .
But, before you recompile the mspdebug binary… try doing what the output wants you to do. Update the FET firmware.
Open a new terminal, and do
cd "C:/Users/DreamLAND/.platformio/packages/tool-mspdebug"
mspdebug.exe dslite --allow-fw-update
what does that output?
thanks for your reply, i got the output like this:
mspdebug.exe dslite --allow-fw-update
MSPDebug version 0.24 - debugging tool for MSP430 MCUs
Copyright (C) 2009-2016 Daniel Beer <dlbeer@gmail.com>
This is free software; see the source for copying conditions. There is NO
warranty; not even for MERCHANTABILITY or FITNESS FOR A PARTICULAR PURPOSE.
----------------- NOTE ------------------
Modified version of mspdebug for Energia
Do not use standalone
-----------------------------------------
Chip info database from MSP430.dll v3.3.1.4 Copyright (C) 2013 TI, Inc.
Using new (SLAC460L+) API
MSP430_GetNumberOfUsbIfs
MSP430_GetNameOfUsbIf
Found FET: COM6
MSP430_Initialize: COM6
FET firmware update is required.
Starting firmware update (this may take some time)...
Initializing bootloader...
Programming new firmware...
75 percent done
84 percent done
84 percent done
91 percent done
96 percent done
99 percent done
100 percent done
100 percent done
Initializing bootloader...
Programming new firmware...
4 percent done
4 percent done
4 percent done
4 percent done
4 percent done
4 percent done
4 percent done
20 percent done
20 percent done
20 percent done
20 percent done
20 percent done
36 percent done
52 percent done
52 percent done
52 percent done
52 percent done
52 percent done
68 percent done
84 percent done
84 percent done
84 percent done
84 percent done
84 percent done
100 percent done
Update complete
Done, finishing...
MSP430_VCC: 3000 mV
MSP430_OpenDevice
MSP430_GetFoundDevice
Device: MSP430F5529 (id = 0x002f)
8 breakpoints available
MSP430_EEM_Init
Chip ID data:
ver_id: 2955
ver_sub_id: 0000
revision: 18
fab: 55
self: 5555
config: 12
Device: MSP430F5529
Available commands:
= fill opt setbreak
alias gdb power setwatch
blow_jtag_fuse help prog setwatch_r
break hexout read setwatch_w
cgraph isearch regs simio
delbreak load reset step
dis load_raw run sym
erase md save_raw verify
exit mw set verify_raw
Available options:
color gdb_default_port
enable_bsl_access gdb_loop
enable_fuse_blow gdbc_xfer_size
enable_locked_flash_access iradix
fet_block_size quiet
Type "help <topic>" for more information.
Use the "opt" command ("help opt") to set options.
Press Ctrl+Z, Enter to quit.

(mspdebug)
what should i do next step? It still won’t start debugging
The update looks like it’s gone through fine.
What is the output of
pio debug --interface=gdb -- -x .pioinit
now?
i got the output just like this
Yeah. No unused fet found. If you still have the other shell open from the mspdebug.exe dslite --allow-fw-update command, you will see that it ended at
Type "help <topic>" for more information.
Use the "opt" command ("help opt") to set options.
Press Ctrl+Z, Enter to quit.
(mspdebug)
you have to quit / exit out of this program, or it will still use the FET.
OMG, the interface of gdb appears.Is this behavior correct?
Yeah. Quit out of that shell again by executing “quit”.
Then use the regular VSCode Debug Sidebar → Play button.
If pio debug can establish the connection in the console, it should work in the VSCode GUI, too.
I’m sorry to say, it can’t work in the VSCode GUI correctly.
Did you exit the previous pio debug session?
What is the output in the VSCode “Debug Console” tab?
Screenshot of VSCode after the Play button has been pressed?
Yeah, I exit the previous pio debug session.
I can guarantee that there are no characters in my path other than English characters.
Before I press the Play Button:
After I press the Play Button
Mhm. When I press the play button, there is definitely output in the debug console. Of course there’s an error since I don’t have any real board connected.
In the VSCOde extensions sidebar, decativate all extensions except C/C++ by Microsoft and PlatformIO. Maybe another extension is intefering.
OK, let me have a try, this is a time consuming task
dreamland7707:
I think this error actually comes when the extension tries to invoke
platformio debug -e <env> -x ...
and the error message is actualy “unknown command: platformio”.
Let’s just check whether only MSP430 doesn’t work or also other enviornments.
Download and open this project in VSCode. Wait for it to initialize, then start a debugging session with the regular debug sidebar → play button for “PIO Debug”. It needs no hardware, it runs in a simulator.
Contribute to maxgerhardt/pio-simple-simavr-debug development by creating an account on GitHub.
If it works, you should see this:
If it doesn’t work, it means something is wrong in general with your system of VSCode installation. We will see.


