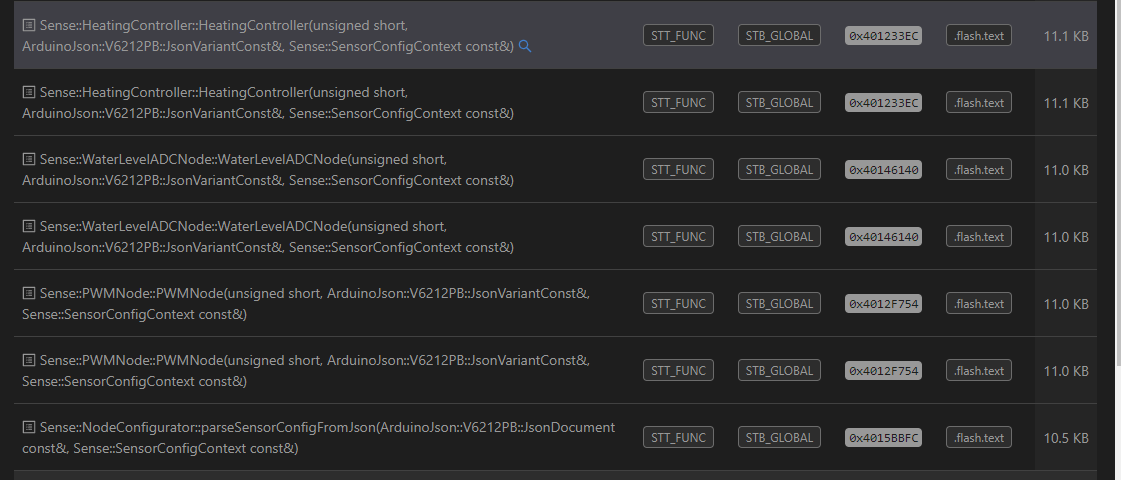
I’m trying to interpret the information that is provided in the memory inspection pages of platformio, but I don’t understand what I’m looking at. It shows i.e. a list of constructors from different classes and some other methods that use ArduinoJson document as a parameter, and in the size column it shows more than 11 Kb. I sure hope that the implementation of those methods doesn;t take over 11 Kb each …
How should I interpret this info? I am looking into this to find potential mewmory hogs that I possibly can optimize, can I et any info on that?
In a nutshell, the inspector doesn’t do any heuristic analysis, it shows what symbols are present in your final binary by parsing the ELF file and DWARF debugging information. Besides, the report is produced in debug mode with several compilation optimizations turned off which also may affect the memory footprint. IMO, it doesn’t seem like those constructors are wasting your memory, mainly because they’re located at the same memory address, although I’d recommend also looking into a map file generated by the linker to make sure whether those constructors actually don’t take memory in your app (if a *.map file is not present in your build folder, just add a new linker flag -Wl,-Map=output.map).