Hello Everyone,I am trying to setup berakpoints using the onboard jtag interface ESP32C3, I can get openocd working and the platform IO gdb seems to connect to the board, it goes though a few restes due to the memory not being accesable but then it takes about 1 minute to jump to the setup, this is with a minimal file. Once there it seems it takes more than 30 seconds to get to the next line.
If I setup a debug_init_break it jumps right there quite quickly as long as there are no python zombies (see later in poste): this is the output
Info : Flash mapping 0: 0x10020 -> 0x3c040020, 55 KB
Info : Flash mapping 1: 0x20020 -> 0x42000020, 202 KB
Info : Using flash bank 'esp32c3.drom' size 56 KB
0x40000000 in ?? ()
Info : Detected FreeRTOS version: (10.5.1)
Info : JTAG tap: esp32c3.cpu tap/device found: 0x00005c25 (mfg: 0x612 (Espressif Systems), part: 0x0005, ver: 0x0)
JTAG tap: esp32c3.cpu tap/device found: 0x00005c25 (mfg: 0x612 (Espressif Systems), part: 0x0005, ver: 0x0)
Info : Reset cause (3) - (Software core reset)
Reset cause (3) - (Software core reset)
Breakpoint 1 at 0x4200d96c: file src/main.cpp, line 257.
Note: automatically using hardware breakpoints for read-only addresses.
PlatformIO: Initialization completed
PlatformIO: Resume the execution to `debug_init_break = break main.cpp:257`
PlatformIO: More configuration options -> https://bit.ly/pio-debug
Info : Detected FreeRTOS version: (10.5.1)
[New Thread 1070170752]
[Remote target exited]
[New Thread 1070151364]
[New Thread 1070149484]
[Switching to Thread 1070170752]
the debug profile I am using is the PIO Debug (without uploading)
I have noticed that the PIO Debug", is compiling but seems to not be able to upload so I do that manually now.
When I have the complete project, it complains of a time out! via the following output:
PlatformIO Unified Debugger -> https://bit.ly/pio-debug
PlatformIO: debug_tool = esp-builtin
PlatformIO: Initializing remote target...
Warning: 'flushregs', an alias for the command 'maintenance flush register-cache', is deprecated.
Use 'maintenance flush register-cache'.

Open On-Chip Debugger  v0.11.0-esp32-20220706 (2022-07-06-15:49)
Licensed under GNU GPL v2
For bug reports, read
	http://openocd.org/doc/doxygen/bugs.html
Info : only one transport option; autoselect 'jtag'
Info : esp_usb_jtag: VID set to 0x303a and PID to 0x1001
Info : esp_usb_jtag: capabilities descriptor set to 0x2000
Warn : Transport "jtag" was already selected
adapter speed: 5000 kHz

Info : tcl server disabled
Info : telnet server disabled
Info : esp_usb_jtag: serial (50:78:7D:47:65:D0)
Info : esp_usb_jtag: Device found. Base speed 40000KHz, div range 1 to 255
Info : clock speed 5000 kHz
Info : JTAG tap: esp32c3.cpu tap/device found: 0x00005c25 (mfg: 0x612 (Espressif Systems), part: 0x0005, ver: 0x0)
Info : datacount=2 progbufsize=16
Error: Abstract command ended in error 'busy' (abstractcs=0x10001102)
Error: Timed out after 5s waiting for busy to go low (abstractcs=0x10001102). Increase the timeout with riscv set_command_timeout_sec.
Error: Abstract command ended in error 'busy' (abstractcs=0x10001102)
Error: Timed out after 5s waiting for busy to go low (abstractcs=0x10001102). Increase the timeout with riscv set_command_timeout_sec.
Error: Abstract command ended in error 'busy' (abstractcs=0x10001102)
Error: Timed out after 5s waiting for busy to go low (abstractcs=0x10001102). Increase the timeout with riscv set_command_timeout_sec.
Error: Fatal: Failed to read MISA from hart 0.
Warn : target esp32c3 examination failed
Info : starting gdb server for esp32c3 on pipe
Info : accepting 'gdb' connection from pipe
Error: Target not examined yet
Error executing event gdb-attach on target esp32c3:

Warn : No symbols for FreeRTOS!
Error: Target not halted
Error: auto_probe failed
Error: Connect failed. Consider setting up a gdb-attach event for the target to prepare target for GDB connect, or use 'gdb_memory_map disable'.
Error: attempted 'gdb' connection rejected
Background I am using ESP home to auto gen the platformIO project and it seems to compile and run as expected. I have added the a few lines to the end of the platformIO.ini to enable debugging:
; Auto generated code by esphome

[common]
lib_deps =
build_flags =
upload_flags =

; ========== AUTO GENERATED CODE BEGIN ===========
[platformio]
description = ESPHome 2025.7.5
[env:kiln-scheduler-pro]
board = esp32-c3-devkitm-1
board_build.partitions = partitions.csv
board_upload.flash_size = 4MB
build_flags =
    -DCORE_DEBUG_LEVEL=5
    -DENABLE_I2C_DEBUG_BUFFER
    -DESPHOME_LOG_LEVEL=ESPHOME_LOG_LEVEL_VERY_VERBOSE
    -DUSE_ESP32
    -DUSE_ESP32_FRAMEWORK_ESP_IDF
    -DUSE_ESP32_VARIANT_ESP32C3
    -DUSE_ESP_IDF
    -Wno-nonnull-compare
    -Wno-sign-compare
    -Wno-unused-but-set-variable
    -Wno-unused-variable
    -fno-exceptions
    -std=gnu++20
build_unflags =
    -std=gnu++11
    -std=gnu++14
    -std=gnu++17
    -std=gnu++23
    -std=gnu++2a
    -std=gnu++2b
    -std=gnu++2c
extra_scripts =
    post:post_build.py
    pre:cxx_flags.py
framework = espidf
lib_compat_mode = strict
lib_deps =
    bblanchon/ArduinoJson@7.4.2
    ${common.lib_deps}
lib_ldf_mode = off
platform = https://github.com/pioarduino/platform-espressif32/releases/download/53.03.13/platform-espressif32.zip
platform_packages =
    pioarduino/framework-espidf@https://github.com/pioarduino/esp-idf/releases/download/v5.3.2/esp-idf-v5.3.2.zip
    espressif/toolchain-esp32ulp@2.35.0-20220830
; =========== AUTO GENERATED CODE END ============
debug_tool = esp-builtin
debug_init_break = tbreak setup
debug_server =
  $PLATFORMIO_CORE_DIR/packages/tool-openocd-esp32/bin/openocd
  -f
  $PLATFORMIO_CORE_DIR/packages/tool-openocd-esp32/share/openocd/scripts/board/esp32c3-builtin.cfg
; debug_port= localhost:3333
build_type = debug
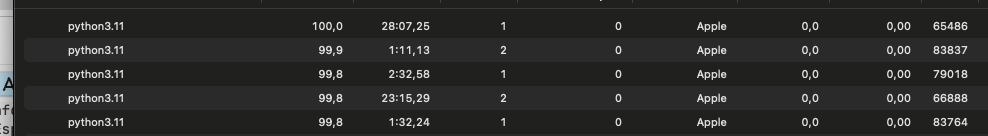
It seems also that when is top the debugger if I was not successful to connect there is a zombie python process running at 100% cpu..
Lastly eveytime I change the debug_init_break in the platformio.ini it recompiles when I try to debug even though I am only using PIO Debug (without uploading)
I am using a mac M3
can someone help me with the points above most importantly is the ability to debug. It must be some config I am messing up.
Thank you in advance, Cheers