Is platformio nrf52 debugger zephyr RTOS aware?

I am going through the nrf52 documentation of Nordic. They provide two IDE paths, VS Code extension with a zephyr RTOS aware debugger (good) and Segger Studio with a single thread debugger (not so good).

https://developer.nordicsemi.com/nRF_Connect_SDK/doc/latest/nrf/gs_programming.html

If I will go with the their option of nrf52/zephyr on platformio on VS Code. Is the platformio debugger zephyr RTOS aware? That is, does it allow to chose the task to view its stack or is it aware only of the current task?

Usually it’s about OpenOCD being Zephyr RTOS aware, not some VSCOde debugger extension. That’s where the base is at.

This is also confirmed by looking at

https://docs.zephyrproject.org/latest/guides/flash_debug/host-tools.html#openocd-debug-host-tools

so if PlatformIO is not using Zephyr’s OpenOCD fork, it will not be Zephyr RTOS aware.

Hm on the other hand, official OpenOCD sources also have the Zephyr source (openocd/src/rtos at master · openocd-org/openocd · GitHub), so maybe it’s about turning on the RTOS detection in the OpenOCD config files like they do in tcl/target/snps*: enable autodetection of RTOS · zephyrproject-rtos/openocd@08d2364 · GitHub.

Have you tried adding that -rtos auto directive in PlatformIO’s target cfg file that you’re using? (C:\Users\<user>\.platformio\packages\tool-openocd\scripts\target\nrf52.cfg line 31)

target create $_TARGETNAME cortex_m -dap $_CHIPNAME.dap -rtos auto

Thanks @maxgerhardt. I made the change in nrf52.cfg:

swj_newdap $_CHIPNAME cpu -expected-id $_CPUTAPID
dap create $_CHIPNAME.dap -chain-position $_CHIPNAME.cpu

set _TARGETNAME $_CHIPNAME.cpu
# Zapta: manually modified.
#target create $_TARGETNAME cortex_m -dap $_CHIPNAME.dap
target create $_TARGETNAME cortex_m -dap $_CHIPNAME.dap -rtos auto

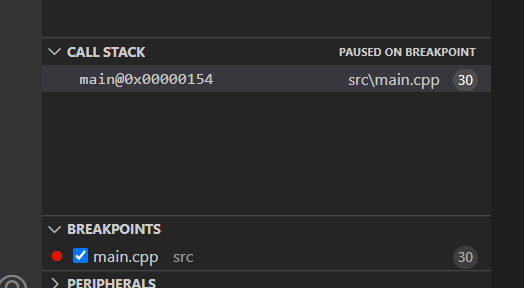
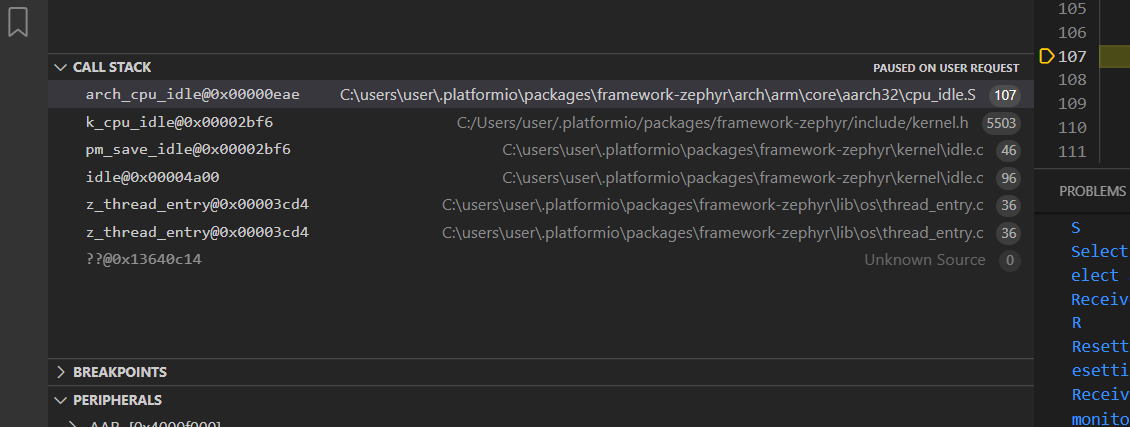
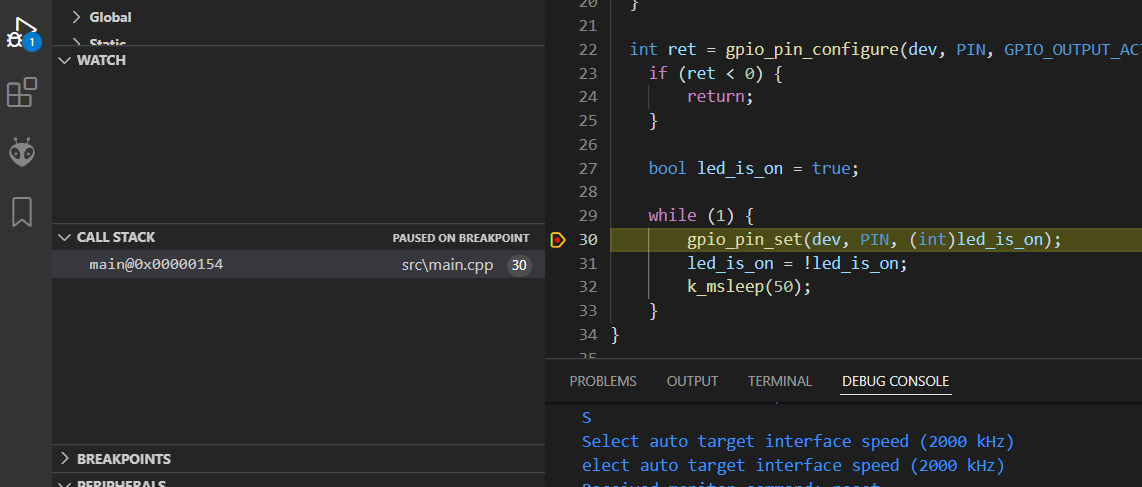
However, when the program pauses in the debugger I can see only one stack at a time. My program is a simple main() with a blinky that does work (looking at the LED). If I let it runs in the debugger and than pause it using the debugger pause button, I see only a stack that seems as the idle thread. If I place a breakpoint in main in my blink loop and continue the program, the program stops there and I see only the stack of what looks as the main thread.

I am not an expert but this suggest that there is more than one stack involved and that the debugger is aware only of the current one, where the program pauses.

Any suggestions? Zephyr is about multi threading and not being able to examine the other threads makes it difficult.

Debug log when starting the debugger

dress 0x0000102A (Data = 0xFE8A)
R
ead 2 bytes @ address 0x00000110 (Data = 0xB538)
Temporary breakpoint 1 at 0x110: file src\main.cpp, line 16.
PlatformIO: Initialization completed
PlatformIO: Resume the execution to `debug_init_break = tbreak main`
PlatformIO: More configuration options -> https://bit.ly/pio-debug
S
etting breakpoint @ address 0x00000110, Size = 2, BPHandle = 0x0001
Starting target CPU...
.
..Breakpoint reached @ address 0x00000110
R
eading all registers
R
emoving breakpoint @ address 0x00000110, Size = 2
Read 4 bytes @ a
ddress 0x00000110 (Data = 0x4819B538)

Temporary breakpoint 1, main () at src\main.cpp:16
16	void main(void) {

The main() thread view
image

The idle thread view

This outpout looks very JLink-like, not at all like OpenOCD. What’s your platformio.ini?

Platformio.ini:

[env:nrf52_dk]
platform = nordicnrf52
board = nrf52_dk
framework = zephyr
build_type = debug

Hm, yes, then it’s through the Segger JLink tools…

That needs a compatible tool-version and at least an additional commandline switch

Can you locally edit your C:\User\<user>\.platformio\platforms\nordicnrf52\platform.py and expand this array

with the values

"-rtos", "GDBServer/RTOSPlugin_Zephyr"

and retry debugging?

Thanks @maxgerhardt. I made the change but I still see only one stack. More information below.

The modified file:

                debug["tools"][link] = {
                    "server": {
                        "package": "tool-jlink",
                        "arguments": [
                            "-singlerun",
                            "-if", "SWD",
                            "-select", "USB",
                            "-device", debug.get("jlink_device"),
                            "-port", "2331",
                            "-rtos", "GDBServer/RTOSPlugin_Zephyr"
                        ],
                        "executable": ("JLinkGDBServerCL.exe"
                                       if platform.system() == "Windows" else
                                       "JLinkGDBServer")
                    }

The debugger startup log

J
LinkARM.dll V7.50a (DLL compiled Jul  8 2021 18:16:52)

Command line: -singlerun -if SWD -select USB -device nRF52832_xxAA
-port 2331 -rtos GDBServer/RTOSPlugin_Zephyr
-----GDB Server start s
ettings-----
GDBInit file:                  none
GDB Server Listening port:     2331
SWO raw output listening port: 2332
Terminal I/O port:             2333
Accept remote connec
tion:      localhost only
Generate logfile:              off
Verify download:               off
Init regs on start:
            off
Silent mode:                   off
Single run mode:               on
Target connection tim
eout:     0 ms
------J-Link related settings------
J-Link Host interface:         USB
J-Link script:
           none
J-Link settings file:          none
------Target related settings------
Target device:
                nRF52832_xxAA
Target interface:              SWD
Target interface speed:        40
00kHz
Target endian:                 little
C
onnecting to J-Link...
J
-Link is connected.
F
irmware: J-Link EDU Mini V1 compiled Nov  2 2021 11:12:01
Hardware:
V1.00
S/N: 801041412
Feature(s): FlashBP, GDB
C
hecking target voltage...
Target voltage: 3.30 V
L
istening on TCP/IP port 2331
Connecting to target...
undefinedC:\Users\user\.platformio\packages\toolchain-gccarmnoneeabi\bin\arm-none-eabi-gdb.exe: warning: Couldn't determine a path for the index cache directory.
C
onnected to target
Waiting for GDB connection...
Reading symbols from c:\projects\ble_stepper_monitor\repo\platformio\.pio\build\nrf52_dk\firmware.elf...
PlatformIO Unified Debugger -> https://bit.ly/pio-debug
PlatformIO: debug_tool = jlink
PlatformIO: Initializing remote target...
C
onnected to 127.0.0.1
R
eading all registers
R
ead 4 bytes @ address 0x00000EAE (Data = 0xF3BFB662)
R
ead 2 bytes @ address 0x00000EAE (Da
ta = 0xB662)
arch_cpu_idle () at C:\users\user\.platformio\packages\framework-zephyr\arch\arm\core\aarch32\cpu_idle.S:107
107		cpsie	i
L
oading RTOS plugin: GDBServer/RTOSPlugin_Zephyr...
R
TOS plugin (API v1.1) loaded successfully
RTOS plugin: Loaded
R
eceived symbol: _kernel (0x20000714)
Received symbol: _kernel_openocd_offsets (0x00000000)
ERROR: Mandatory symbol _kernel_openocd_offsets not found
.
Reading 64 bytes @ address 0x00000E80
R
eceived monitor command: clrbp
R
eceived monitor command: speed au
to
S
Select auto target interface speed (2000 kHz)
elect auto target interface speed (2000 kHz)
Received monitor command: reset
R
Resetting target
esetting target
Received mon
itor command: halt
Halting target CPU..
.
...Target halted (PC = 0x000013C4)
Loading section rom_start, size 0xdc lma 0x0
D
ownloading 220 bytes @ address 0x00000000
Loading section text, size 0x4c1c lma 0xdc
D
ownloading 16020 bytes @ address 0x000000DC
D
Loading section .ARM.exidx, size 0x8 lma 0x4cf8
ownloading 3464 bytes @ address 0x00003F70
Downloading 8 bytes @ address 0x00004CF8
Loading section initlevel, size 0x38 lma 0x4d00
Loading section devices, size 0x60 lma 0x4d38
Downloading 56 bytes @ address 0x00004D00
Downloading 96 bytes @ address 0x00004D38
Downloading 312 bytes
Loading section sw_isr_table, size 0x138 lma 0x4d98
Loading section device_handles, size 0x1a lma 0x4ed0
@ address 0x00004D98
Downloading 26 bytes @ address 0x00004ED0
Downloading 368 bytes @ address
Loading section rodata, size 0x170 lma 0x4ef0
Loading section datas, size 0x2c lma 0x5060
0x00004EF0
Downloading 44 bytes @ address 0x00005060
Downloading 16 bytes @ address 0x0000508C
Loading section device_states, size 0x10 lma 0x508c
Start address 0x13c4, load size 20630
W
riting register (PC = 0x    13c4)
Transfer rate: 6715 KB/sec, 1875 bytes/write.
R
ead 4 bytes @ address 0x000013C4 (Data = 0xFC96F003)
R
ead 2 bytes @ address 0x000013C4 (Data = 0xF003)
R
ead 2 bytes @ address 0x000013C6 (Data = 0xFC96)
Read 2 bytes @ address 0x00000110 (Data = 0xB538)
Temporary breakpoint 1 at 0x110: file src\main.cpp, line 16.
PlatformIO: Initialization completed
PlatformIO: Resume the execution to `debug_init_break = tbreak main`
PlatformIO: More configuration options -> https://bit.ly/pio-debug
S
etting breakpoint @ address 0x00000110, Size = 2, BPHandle = 0x0001
S
tarting target CPU...
.
..Breakpoint reached @ address 0x00000110
R
eading all registers
R
emoving breakpoint @ addre
ss 0x00000110, Si
ze = 2
R
ead 4 bytes @ address 0x00000
110 (Data = 0x
4819B538)

Temporary breakpoint 1, main () at src\main.cpp:16
16	void main(void) {

The stack list I get when pausing the program (only the current idle thread is listed, the main thread is not)

Try adding

CONFIG_THREAD_MONITOR=y
CONFIG_DEBUG_THREAD_INFO=y

to your zephyr/proj.cnf

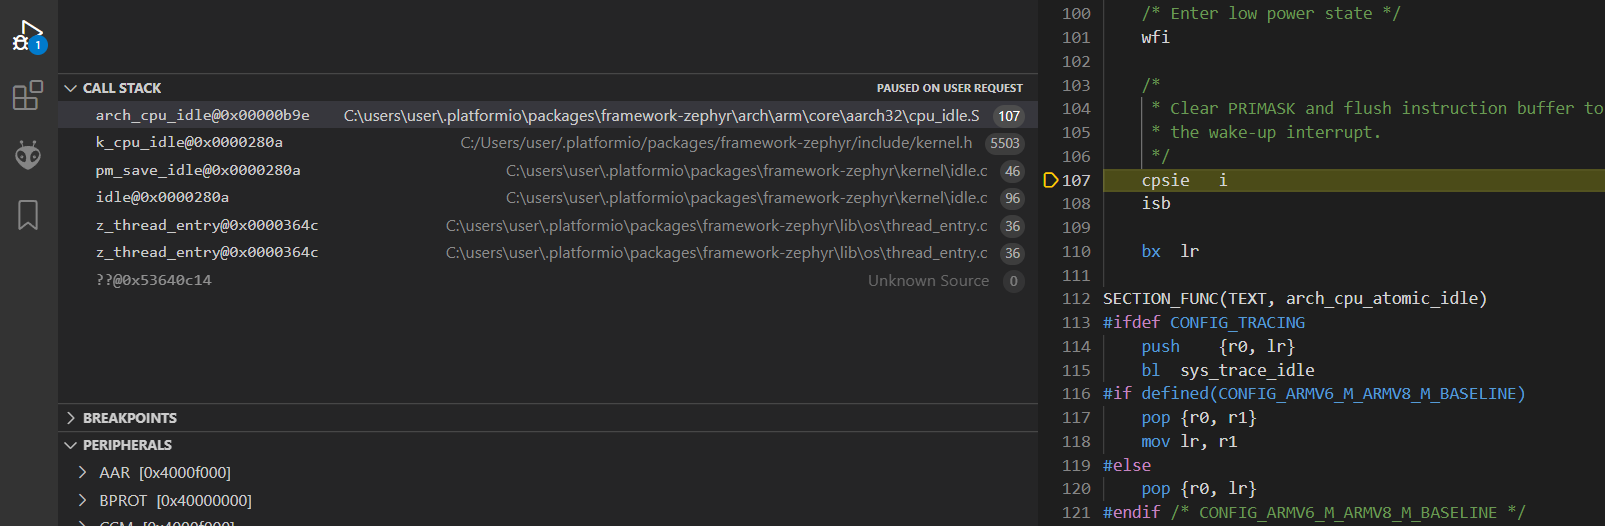
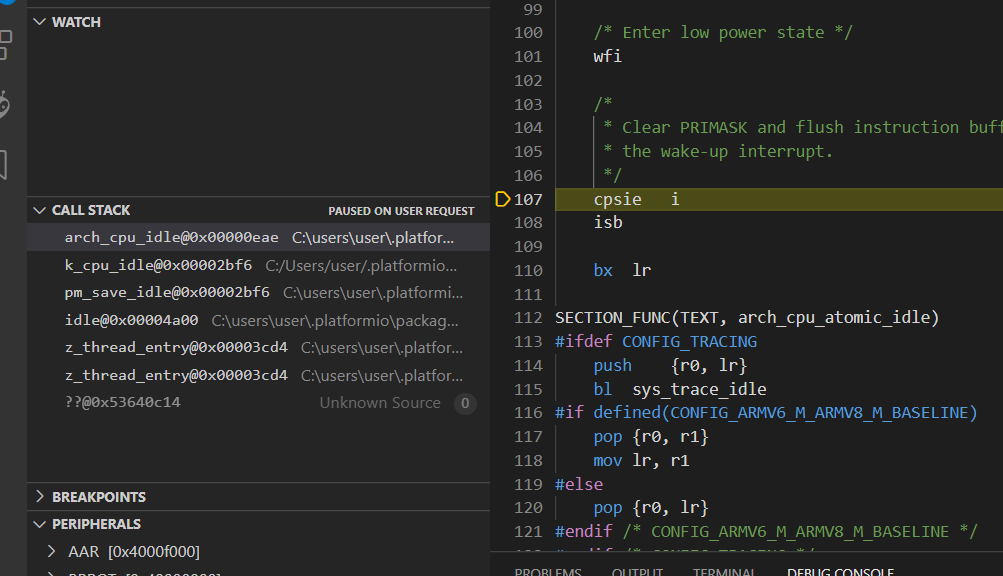
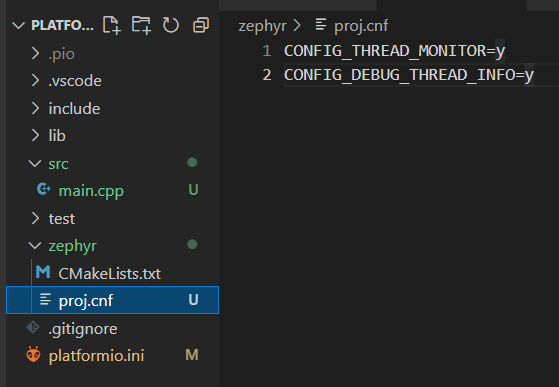
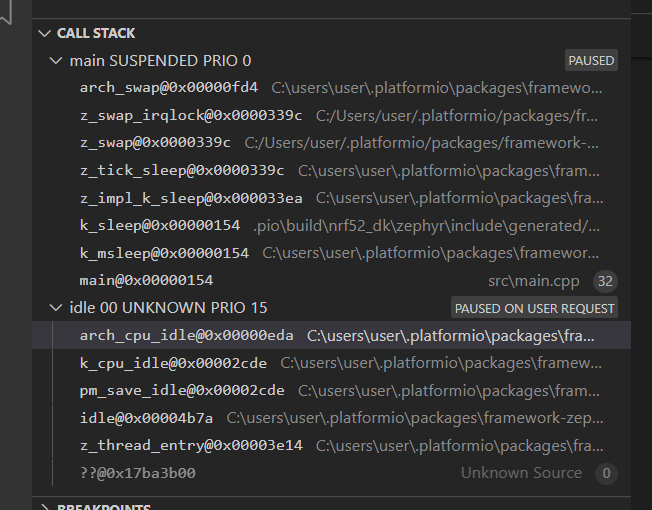
The zephyr directory of my platformio project didn’t have a proj.cnf file so I created it manually (it was not created by the platformio new project function). However, I am still seeing only one stack at a time. More information below

The new zephyr/proj.cnf file:

image

The debugger startup log

J
LinkARM.dll V7.50a (DLL compiled Jul  8 2021 18:16:52)

Command line:
-singlerun -if SWD -select USB -device nRF52832_xxAA -port
 2331 -rtos GDBServer/RTOSPlugin_Zephyr
-----GDB Server start settings-----
GDBInit file:                  n
one
GDB Server Listening port:     2331
SWO raw output listening port: 2
332
Terminal I/O port:             2333
Accept remote connection:
 localhost only
Generate logfile:              off
Verify download:
  off
Init regs on start:            off
Silent mode:
  off
Single run mode:               on
Target connection timeout:     0 ms

------J-Link related settings------
J-Link Host interface:         US
B
J-Link script:                 none
J-Link settings file:          none
-
-----Target related settings------
Target device:                 nRF528
32_xxAA
Target interface:              SWD
Target interface speed:
   4000kHz
Target endian:                 little
C
onnecting to J-Link...
J
-Link is connected.
F
irmware: J-Link EDU Mini V1 compiled Nov  2 2021 11:12:01
Hardware: V1.00
S/N: 801041412

Feature(s): FlashBP, GDB
C
hecking target voltage...
Target voltag
e: 3.30 V
L
istening on TCP/IP
 port 2331
Connect
ing to target...
undefinedC:\Users\user\.platformio\packages\toolchain-gccarmnoneeabi\bin\arm-none-eabi-gdb.exe: warning: Couldn't determine a path for the index cache directory.
C
onnected to target
Waiting for GDB connection...
Reading symbols from c:\projects\ble_stepper_monitor\repo\platformio\.pio\build\nrf52_dk\firmware.elf...
PlatformIO Unified Debugger -> https://bit.ly/pio-debug
PlatformIO: debug_tool = jlink
PlatformIO: Initializing remote target...
C
onnected to 127.0.0.1
R
eading all registers
R
ead 4 bytes @ address 0x00000EAE (Data = 0xF3BFB662)
R
ead 2 bytes @ address 0x00000EAE (D
ata = 0xB662)
arch_cpu_idle () at C:\users\user\.platformio\packages\framework-zephyr\arch\arm\core\aarch32\cpu_idle.S:107
107		cpsie	i
L
oading RTOS plugin: GDBServer/RTOSPlugin_Zephyr...
R
TOS plugin (API v1.1) loaded successfully
RTOS plugin: Loaded
R
eceived symbol: _kernel (0x20000714)
Received symbol: _kernel_openocd_offsets (0x00000000)
ERROR:
Mandatory symbol _kernel_openocd
_offsets not found.
Reading 64 bytes @ address 0x00
000E80
R
eceived monitor command: clrbp
Receive
d monitor command: speed auto
S
Select auto target interface speed (2000 kHz)
elect auto target interface speed (2000 kHz)
Received monitor command: reset
R
Resetting target
esetting target
Received
monitor command: halt
Halting target CPU...
...Target halted (PC = 0x000013C4)
Loading section rom_start, size 0xdc lma 0x0
D
ownloading 220 bytes @ address 0x00000000
Loading section text, size 0x4c1c lma 0xdc
D
ownloading 16020 bytes @ address 0x000000DC
D
Loading section .ARM.exidx, size 0x8 lma 0x4cf8
ownloading 3464 bytes @ address 0x00003F70
Downloading 8 bytes @ address 0x00004CF8
Loading section initlevel, size 0x38 lma 0x4d00
Downloading 56 bytes @ address 0x00004D00
Loading section devices, size 0x60 lma 0x4d38
Downloading 96 bytes @ address 0x00004D38
Downloading 312 bytes @ address
Loading section sw_isr_table, size 0x138 lma 0x4d98
Loading section device_handles, size 0x1a lma 0x4ed0
0x00004D98
Downloading 26 bytes @ address 0x00004ED0
Downloading 368 bytes
Loading section rodata, size 0x170 lma 0x4ef0
Loading section datas, size 0x2c lma 0x5060
@ address 0x00004EF0
Downloading 44 bytes @ address 0x00005060
Loading section device_states, size 0x10 lma 0x508c
Start address 0x13c4, load size 20630
Downloading 16 bytes @ address 0x0000508C
W
riting register (PC = 0x    13c4)
Transfer rate: 6715 KB/sec, 1875 bytes/write.
R
ead 4 bytes @ address 0x000013C4 (Data = 0xFC96F003)
R
ead 2 bytes @ address 0x000013C4 (Data = 0xF003)
R
ead 2 bytes @ address 0x000013C6 (Data = 0xFC96)
R
ead 2 bytes @ address 0x00000110 (Data = 0xB538)
Temporary breakpoint 1 at 0x110: file src\main.cpp, line 16.
PlatformIO: Initialization completed
PlatformIO: Resume the execution to `debug_init_break = tbreak main`
PlatformIO: More configuration options -> https://bit.ly/pio-debug
S
etting breakpoint @ address 0x00000110, Size = 2, BPHandle = 0x0001
Starting target CP
U...
.
..Breakpoint reached @ address 0x00000110
R
eading all registers
R
emoving breakpoint @ address 0x00000110, Size = 2
R
ead 4 bytes @ address 0x00000110 (Data = 0x4819B538)

Temporary breakpoint 1, main () at src\main.cpp:16
16	void main(void) {
S
tarting target CPU...
D
ebugger requested to halt target...
.
..Target halted (PC = 0x00000EAE)
R
eading all registers


Program
R
 received signal SIGTRAP, Trace/breakpoint trap.
ead 4 bytes @ address 0x00000EAE (Data = 0xF3BFB662)
Read 2 bytes @ address 0x00000EAE (Data = 0xB662)
arch_cpu_idle () at C:\users\user\.platformio\packages\framework-zephyr\arch\arm\core\aarch32\cpu_idle.S:107
107		cpsie	i
R
eading 64 bytes @ address 0x00000E80
R
ead 4 bytes @ address 0x00002BF6 (Data = 0x0714E7FB)
R
eading 64 bytes @ address 0x20000CC0
R
ead 4 bytes @ address 0x00004A00 (Data = 0x2000E7F4)
R
ead 4 bytes @ address 0x00003CD4 (Data = 0xFB32F7FF)
R
ead 4 bytes @ address 0x00003CD4 (Data = 0xFB32F7FF)
R
ead 4 bytes @ address 0x13640C14 (Data = 0x00000000)
R
ead 4 bytes @ address 0x13640C14 (Data = 0x00000000)

The idle thread (only)

The main thread (only)

Sorry, the filename is zephyr/prj.conf. (example).

Bingo!!! Thanks @maxgerhardt! Please see picture below.

Currently I have these two platformio managed files modified manually. Is there a way to avoid it, having all the changes in my project directory?

./packages/tool-openocd/scripts/target/nrf52.cfg
./platforms/nordicnrf52/platform.py

OpenOCD is unused here since your JLink probe is used with the tool-jlink software and not OpenOCD (although OpenOCD can technically also use the JLink…). So only the platform.py change is relevant.

You should be able to do a debug_server expression that has the necessary flags.

Does something like

debug_tool = custom
debug_port = :2331
debug_server =
   $PROJECT_PACKAGES_DIR/tool-jlink/JLinkGDBServerCL.exe
   -singlerun
   -if
   SWD
   -select
   USB
   -device
   nRF52832_xxAA
   -port
   2331
   -rtos
   GDBServer/RTOSPlugin_Zephyr

in the platformio.ini work even when you revert platform.py changes?

(If not, try replacing the path to JLinkGDBServerCL with the full expanded path for your computer)

BTW Activate JLink's Zephyr-aware debugging by maxgerhardt · Pull Request #145 · platformio/platform-nordicnrf52 · GitHub is open in regards to that.

Thanks @maxgerhardt. I presume that with that pull request the manual editing or custom debug server will not be necessary. Right?

I tried to add the custom server properties but got this error

undefinedError: Could not launch Debug Server '$PROJECT_PACKAGES_DIR/tool-jlink/JLinkGDBServerCL.exe'. Please check that it is installed and is included in a system PATH

I tried to replace the path with a full windows path but got a different error. If the pull request will make all of this unnecessary, I can continue for a while with the manual editing until the PR will get released.

Correct.

Could you try

debug_tool = custom
debug_port = :2331
debug_server =
    ${platformio.packages_dir}/tool-jlink/JLinkGDBServerCL.exe
   -singlerun
   -if
   SWD
   -select
   USB
   -device
   nRF52832_xxAA
   -port
   2331
   -rtos
   GDBServer/RTOSPlugin_Zephyr

?

I will try and report here. I deleted a few directories from .platformio so it takes some time to load a fresh updates.

I deleted a few packages from .platformio and tried the platformio.ini below

[env:nrf52_dk]
platform = nordicnrf52
board = nrf52_dk
framework = zephyr
build_type = debug
;debug_build_flags = -O0 -g -ggdb
debug_tool = custom
debug_port = :2331
debug_server =
    ${platformio.packages_dir}/tool-jlink/JLinkGDBServerCL.exe
   -singlerun
   -if
   SWD
   -select
   USB
   -device
   nRF52832_xxAA
   -port
   2331
   -rtos
   GDBServer/RTOSPlugin_Zephyr

The debugger gave the error below

undefinedError: Could not launch Debug Server 'C:\Users\user\.platformio\packages/tool-jlink/JLinkGDBServerCL.exe'. Please check that it is installed and is included in a system PATH
See https://docs.platformio.org/page/plus/debugging.html

Looking at my .platformio directory, the tool-jlink is not there. Do I need to add dependency to my platformio to cause the load of that tool? (It’s one of the packages I deleted)

C:\Users\user\.platformio\packages>dir C:\Users\user\.platformio\packages
 Volume in drive C has no label.
 Volume Serial Number is 0EAC-4058

 Directory of C:\Users\user\.platformio\packages

04/03/2022  03:21 PM    <DIR>          .
04/03/2022  03:21 PM    <DIR>          ..
04/02/2022  06:31 PM    <DIR>          contrib-piohome
04/03/2022  03:28 PM    <DIR>          framework-zephyr
04/02/2022  09:17 AM    <DIR>          tool-cmake
04/02/2022  09:18 AM    <DIR>          tool-dtc
04/02/2022  09:18 AM    <DIR>          tool-ninja
04/02/2022  09:18 AM    <DIR>          tool-scons
04/02/2022  09:17 AM    <DIR>          tool-sreccat
04/02/2022  09:14 AM    <DIR>          toolchain-gccarmnoneeabi
04/02/2022  06:32 PM    <DIR>          toolchain-gccarmnoneeabi@1.70201.0
               0 File(s)              0 bytes
              11 Dir(s)  142,604,414,976 bytes free

Try pressing the debug button once, it should install debug erlated packages…

I tried pressing the RUN AND DEBUG green button but still not packages/tool-jlink.

Does platformio know that my custom server depends on the jlink tool?