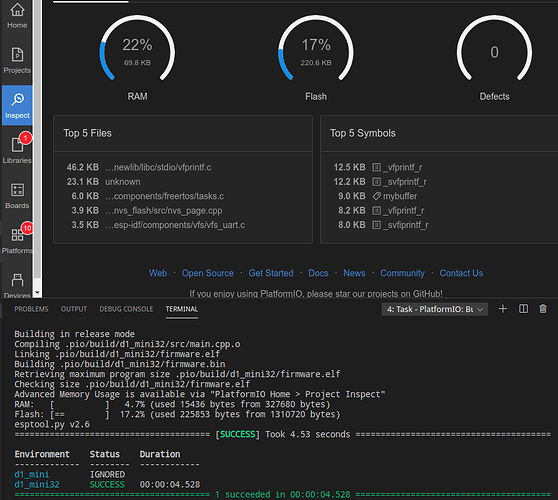
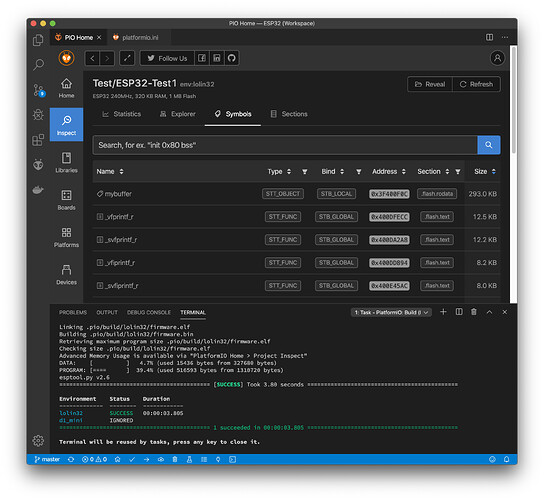
Inspect: Strange RAM size with ESP32

I have the following really simple test code:

#include <Arduino.h>

const char mybuffer[] PROGMEM = {
  0, 1, 2, 3, 4, 5, 6, 7, 8, 9, 0, 1, 2, 3, 4, 5, 6, 7, 8, 9, 0, 1, 2, 3, 4, 5, 6, 7, 8, 9, 0, 1, 2, 3, 4, 5, 6, 7, 8, 9, 0, 1, 2, 3, 4, 5, 6, 7, 8, 9,

  ... ~300kb ...

  0, 1, 2, 3, 4, 5, 6, 7, 8, 9, 0, 1, 2, 3, 4, 5, 6, 7, 8, 9, 0, 1, 2, 3, 4, 5, 6, 7, 8, 9, 0, 1, 2, 3, 4, 5, 6, 7, 8, 9, 0, 1, 2, 3, 4, 5, 6, 7, 8, 9,
};

void setup() {
  Serial.begin(115200);
  delay(4000);
  Serial.println(strlen(mybuffer));
}

void loop() { }

without “mybuffer” the build process shows the following final data and program sizes for the esp32 and the esp8266 platform

Processing lolin32 (platform: espressif32@1.11.1; board: lolin32; framework: arduino)
DATA: [ ] 4.7% (used 15436 bytes from 327680 bytes)
PROGRAM: [== ] 16.5% (used 216509 bytes from 1310720 bytes)

Processing d1_mini (platform: espressif8266@2.3.2; board: d1_mini; framework: arduino)
DATA: [=== ] 32.8% (used 26876 bytes from 81920 bytes)
PROGRAM: [== ] 24.9% (used 260588 bytes from 1044464 bytes)

with “mybuffer” included

Processing lolin32 (platform: espressif32@1.11.1; board: lolin32; framework: arduino)
DATA: [ ] 4.7% (used 15436 bytes from 327680 bytes)
PROGRAM: [==== ] 39.4% (used 516593 bytes from 1310720 bytes)

Processing d1_mini (platform: espressif8266@2.3.2; board: d1_mini; framework: arduino)
DATA: [=== ] 32.8% (used 26876 bytes from 81920 bytes)
PROGRAM: [===== ] 53.7% (used 560900 bytes from 1044464 bytes)

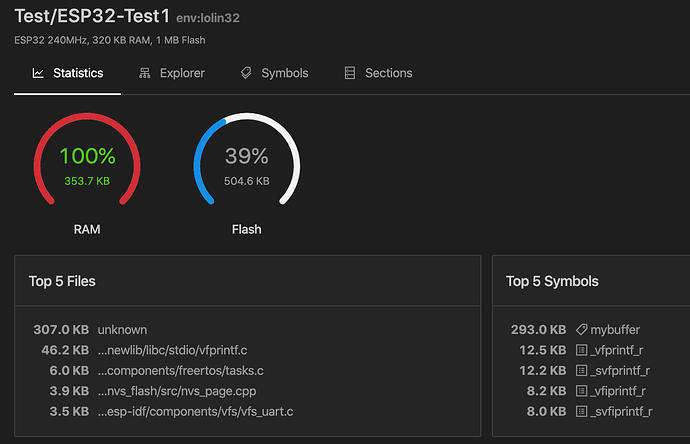
I do not understand why Inspect shows 100% RAM usage, with “mybuffer” included, for the esp32 while for the esp8266 it shows 33% only and everything seams to be ok.
I’ve checked it now with the esp-idf also, it has the same behavior as with the arduino framework … as i expected.

Am I right in understanding/thinking that the underlying issue appears to be that project inspection isn’t realising the variable is of PROG_MEM type, hence not stored in SRAM? And inspection giving those false results (which conflict with the compile results) only with espressif32 targets, not espressif8266 ones?

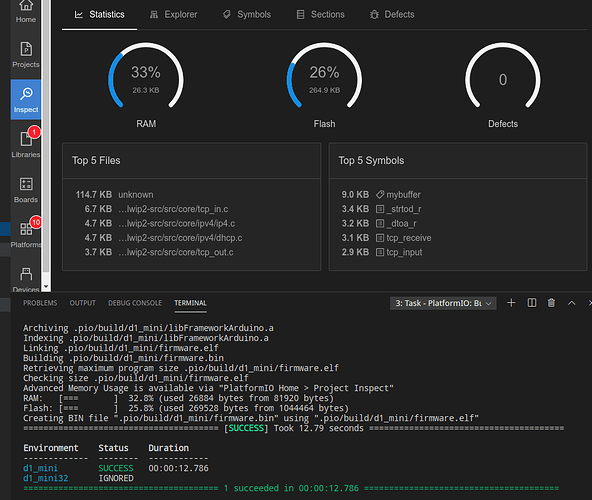
i.e., with a smaller example, of about 40 lines of data in the progmem variable:

ESP8266 inspection RAM / Flash is the same as the compile values:

ESP32 inspection RAM / Flash is different to the compile values:

Yes, this is exact the case. :slight_smile:

Any ideas @valeros @ivankravets ? It seems on the espressif32 platform the code inspection checks thinks PROGMEM variables still take up SRAM space, in conflict with the compiler output.

Hi @thorsten-l!
Thanks for reporting. Could you please specify which section mybuffer is located in?
Also, let me try to shed some light on this matter in the case of espressif32.
As you may know, there are three regions of RAM in espressif32 mcu: DRAM, IRAM, D/IRAM (it’s also possible to use an external IC as DRAM). The memory usage report after a simple compilation is parsed by the following regex:

    SIZEPROGREGEXP=r"^(?:\.iram0\.text|\.iram0\.vectors|\.dram0\.data|\.flash\.text|\.flash\.rodata|)\s+([0-9]+).*",
    SIZEDATAREGEXP=r"^(?:\.dram0\.data|\.dram0\.bss|\.noinit)\s+([0-9]+).*",

As you can see, .iram0.text section is attributed to PROGRAM, nonetheless it’s still RAM, but yes, it’s used for storing executable data. In board manifests, you can see "maximum_ram_size": 327680, 327680 is the size of DRAM region and it’s done on purpose, because DRAM is the main R/W RAM region used for stack, heap, static variables, etc. When the Project Inspector analyzes your firmware, it doesn’t known about these limitations, it’s simply looks at each symbol in your firmware and then decides which section it belongs to. In my opinion, Project Inspector is a bit more accurate, as it relies on ELF sections, the type of each section is based on it’s attributes.

Just to wrap up, we can increase the ram size in board manifests to 520Kb (SRAM0+SRAM1+SRAM2), but it might be misleading for users, as they cannot use the entire RAM for their application.

Does this screenshot help?

I have the same problem. The inspection shows me a totally different result. The terminal sais that i have 15.7% used RAM but the inspector sais that i used more then 100%. what?

Having this same issue. The compile output is reverse of the Inspect tool
Wrover 16MB ESP32
Windows
VSCode
Platformio 4.3.4
Espressif32 1.12.4