See build_type = debug.
Is that the case though? I don’t know the internals of the tool but looking at -Og or -O0 compiled binaries / ELF files wouldn’t be representative of the release binary in a lot of cases, more as a “general landmark”, I agree. I’m sure @ivankravets knows how it works internally.
Btw, you can also set GCC to create a .map file (Generate a .map file - #6 by ivankravets) from which the sizes can be equally analyzed, using e.g. Amap | Sergey Sikorskiy or GitHub - bmwcarit/Emma: Emma Memory and Mapfile Analyser. (Repo marked private after security audit. Contact Marian Kneer for details) or GitHub - ARMmbed/mbed-os-linker-report: Post-processing of linker output to calculate and visualize memory usage for elf-sections.
The latter even just takes an .ELF file and generates an interactive HTML page for exploration. When I e.g. use the stm32cube-hal-blink project and run the release-binary through that, using
python elfsize.py -b -i C:\Users\<user>\Documents\Platformio\Projects\forum_test\.pio\build\nucleo_f103rb\firmware.elf
(while having a GCC-ARM toolchain in my PATH), I get, e.g. regarding the HAL_GPIO_Init() function
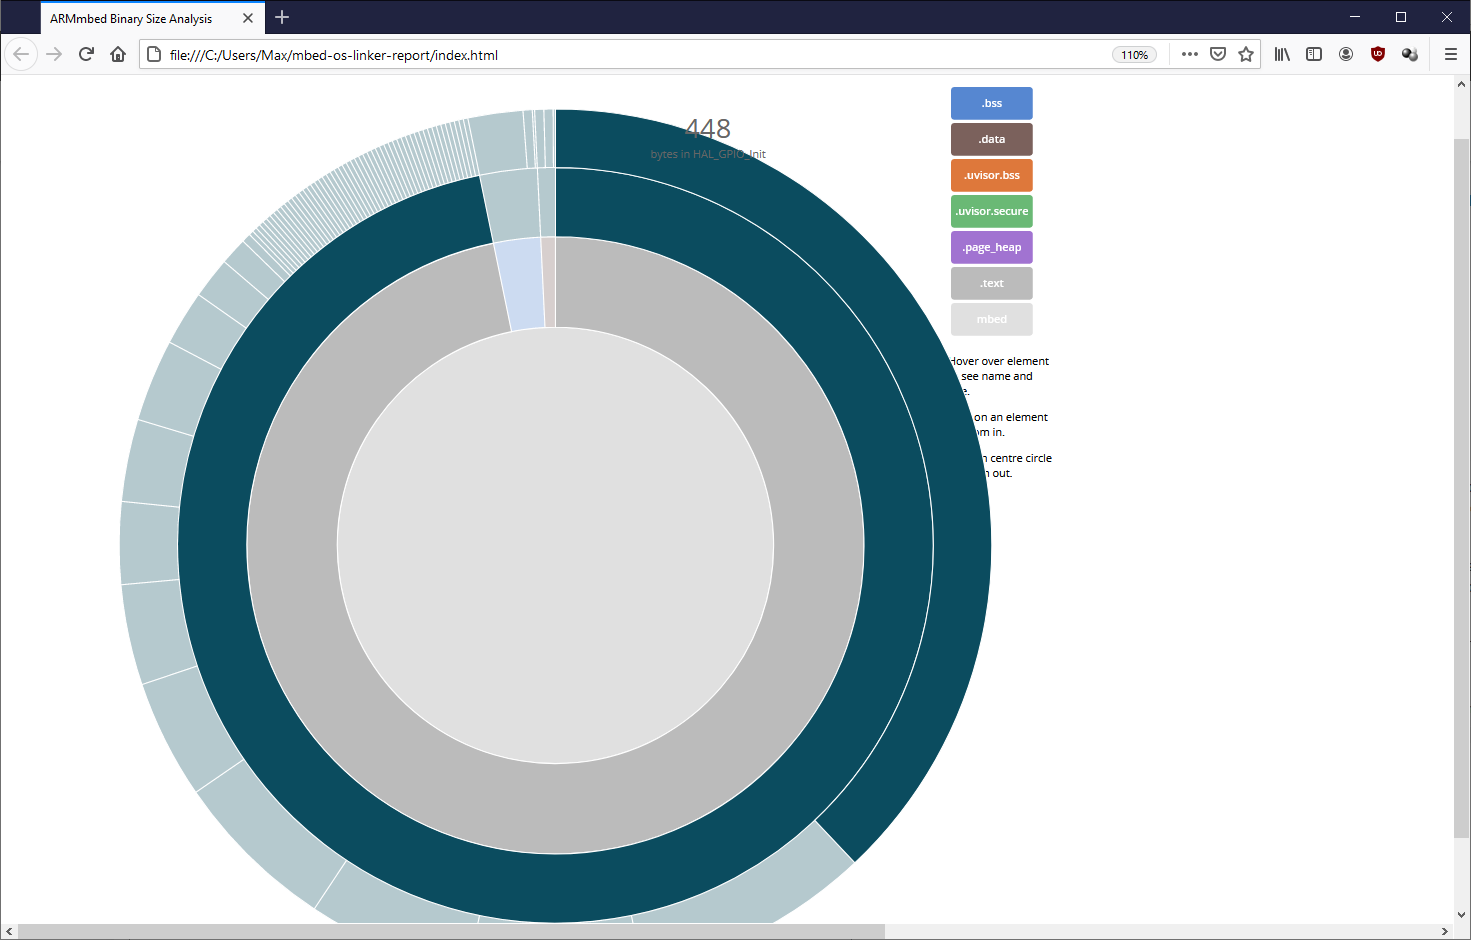
448 bytes of code. When I run it through the PlatformIO’s project inspector, Iget
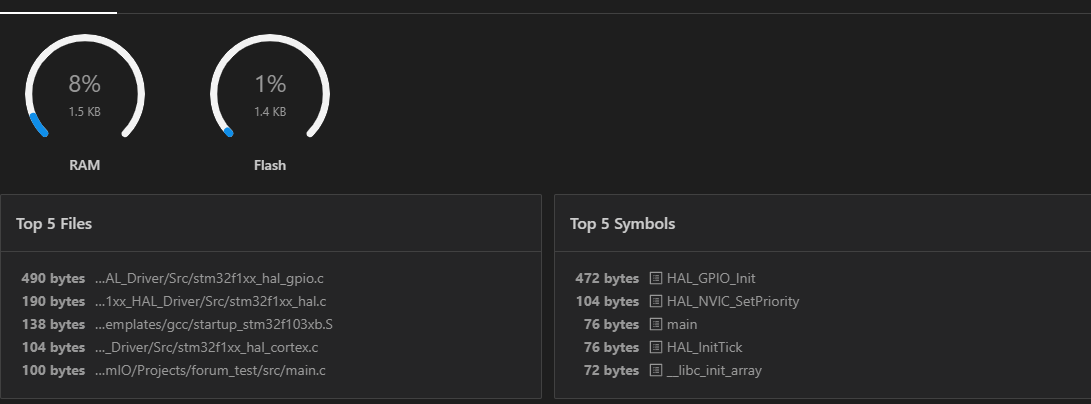
472 bytes.
When re-run the mbed-os-linker-report tool on the ELF file that has been compiled with build_type = debug, I get
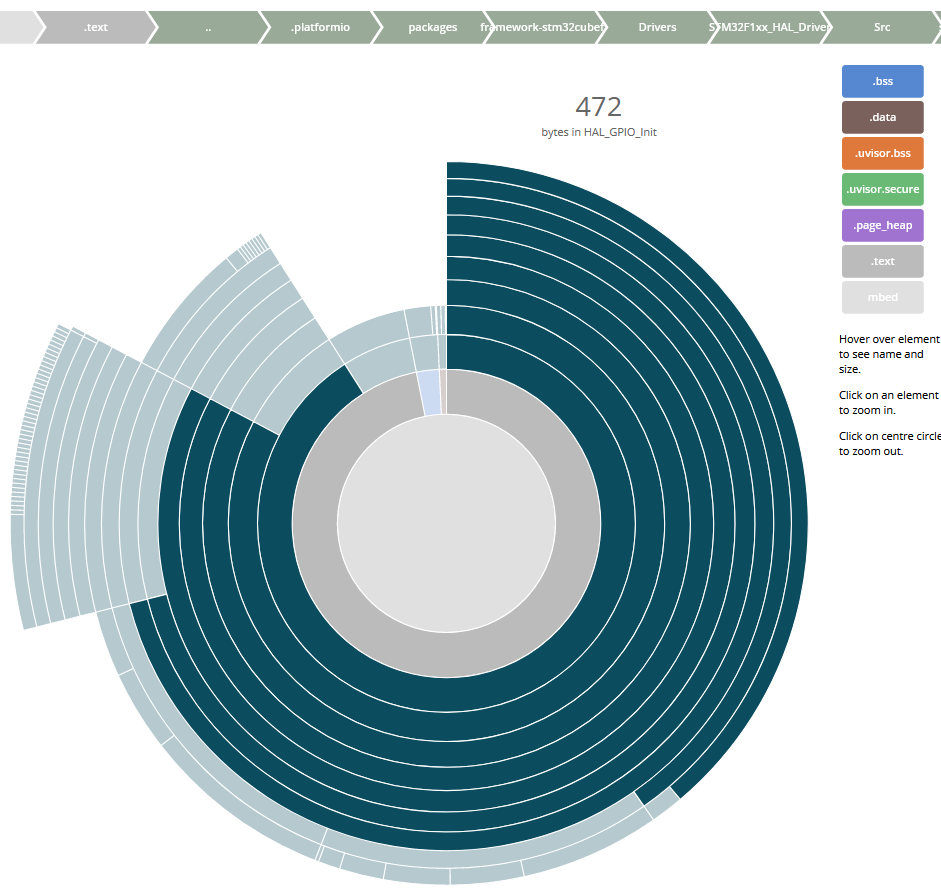
Yeah indeed 472 bytes as well. So it really does look at the debug output.
Maybe that can be improved or at least a setting can be provided to analyze the release build, e.g. with the help of the .map file if certain symbol / debug information isn’t in the ELF file anymore?