The flash memory consumption of the debug build is significantly more than that of the release build, mostly because different optimization. As far as I see, the memory inspection looks at the debug build. Looking at my longest function, I reduced its memory footprint by 2.6 kBytes, just by declaring something constexpr. The overall size of the release build did not change at all. Most probably, the calls were optimized out in release, anyway.
My aim is to reduce the flash footprint of the release build. Would it be possible to run the inspection upon the release build? Alternatively, can I specify the same optimization level for the debug build as for the release build?
platform: atmelsam
framework: arduino
board: due
toolchain-gccarmnoneeabi@1.90301.200702
Is that the case though? I don’t know the internals of the tool but looking at -Og or -O0 compiled binaries / ELF files wouldn’t be representative of the release binary in a lot of cases, more as a “general landmark”, I agree. I’m sure @ivankravets knows how it works internally.
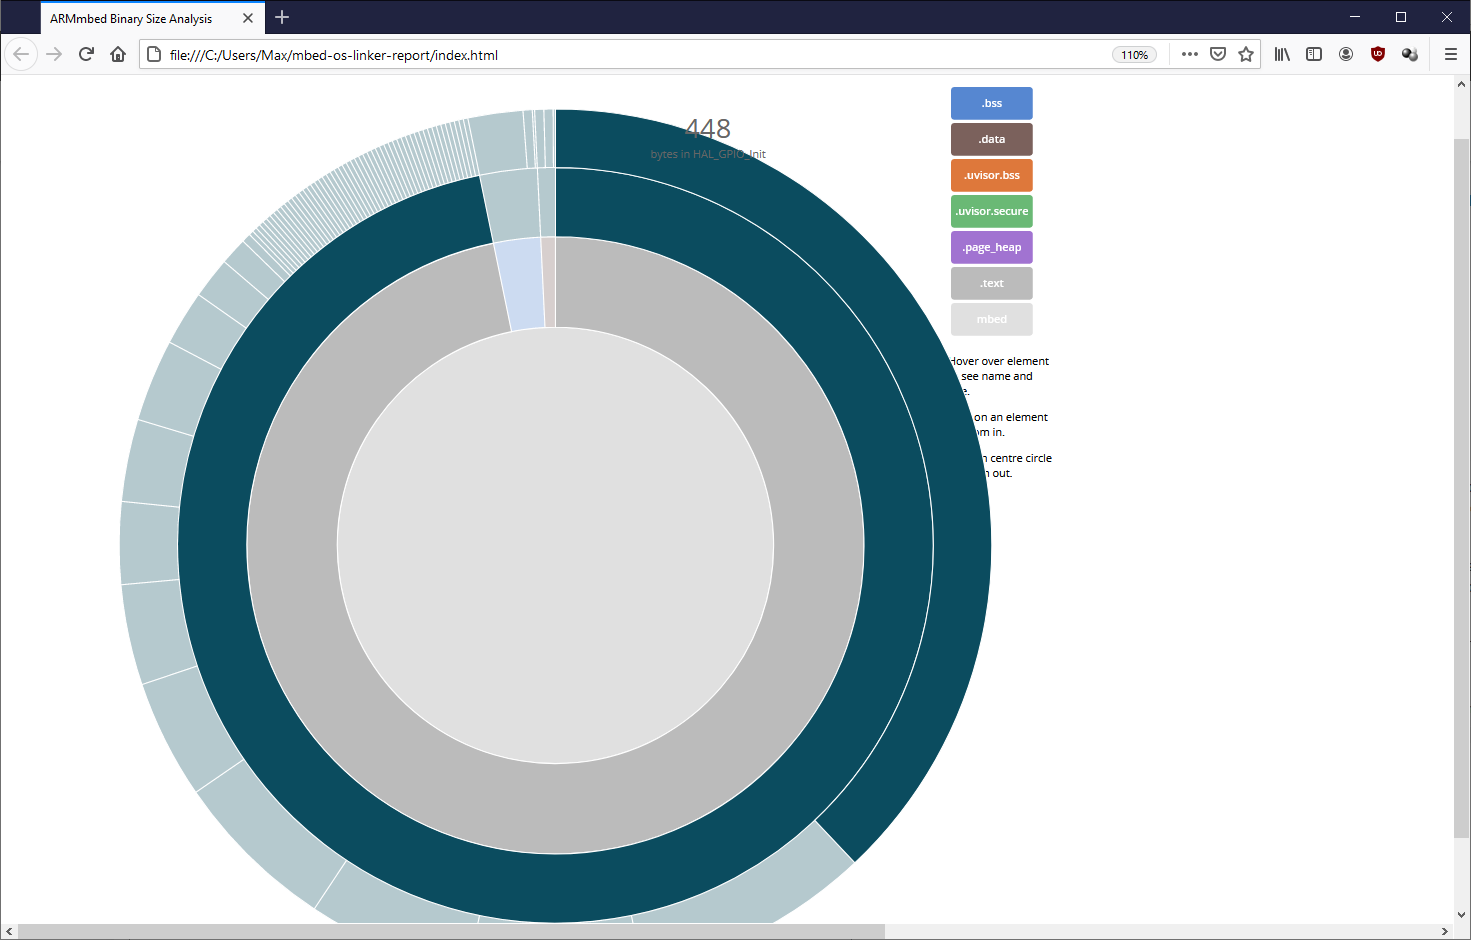
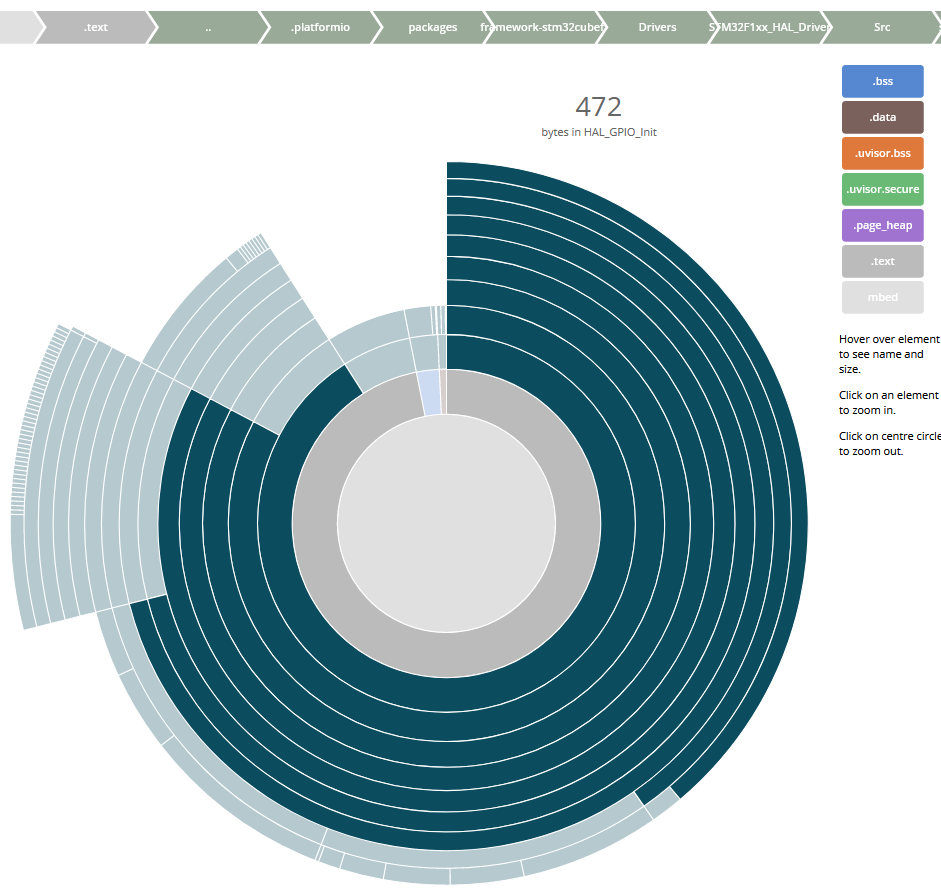
The latter even just takes an .ELF file and generates an interactive HTML page for exploration. When I e.g. use the stm32cube-hal-blink project and run the release-binary through that, using
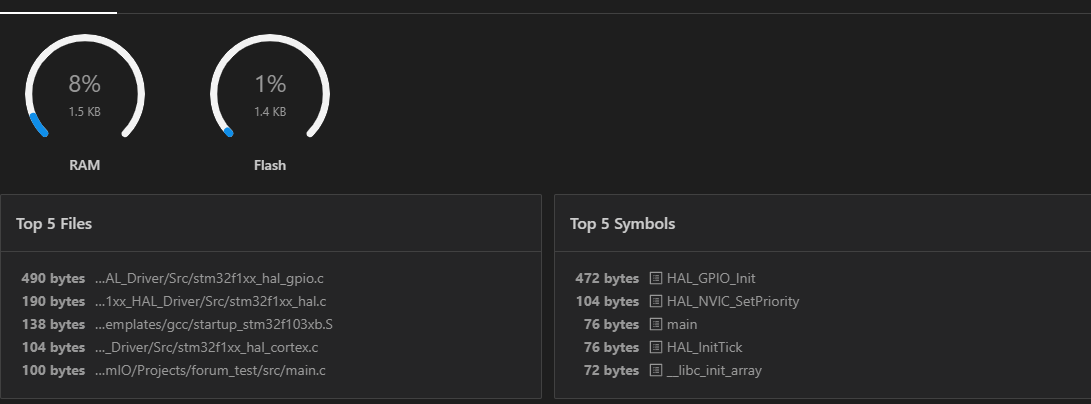
Yeah indeed 472 bytes as well. So it really does look at the debug output.
Maybe that can be improved or at least a setting can be provided to analyze the release build, e.g. with the help of the .map file if certain symbol / debug information isn’t in the ELF file anymore?
At the moment the “Project Inspector” only works with ELF files compiled in debug mode. The main reason is that we need additional information (like symbol locations) to prepare a comprehensive report. A map file is a potential workaround, but we support so many different platforms with different toolchain versions that makes parsing map files a pretty complicated task.