How to 'view' multiple (or one) pin states as Watches

Hello; I’d be gratefull for any advise on the following…

I’m new to VSC, PlatformIO, the ESP32 and proper debugging - other than VB in Excel. As such, I’m on a very steep curve that has me struggling at most stages.

The first query I have is; given that compiling can change the order of variables etc, is there a way that stops optimisation completely - so that program flow is WYSIWYG - as they used to say. I’d like to not have lines oddly jumped and to not see variables “optimized” so that I never get to know their value starring at me. I found a reference and plucked the line “-fno-toplevel-reorder” from it and it seems to improve things - but not completely. I’ve also tried -og, -g and a few others - but with even less success.

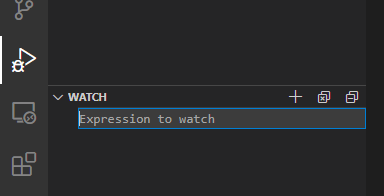
I’d also like to know how to put a watch on GPIO pin 26 for example and it would be great to have a row of pin state feedback. I could try to find a way of not losing variables to the optimisation process, but a Watch sounds much cleaner to me.

Many thanks!

When you debug the program through the PlatformIO unified debugger, the program is automatically recompiled in debug mode, meaning not -Os optimization level is used (which does the reordering and optimizing), but -Og, (“optimize debug”). That should stop reordering.

Still, through debug_build_flags you can fully control what build flags are used for compiling in debug mode. The default is -Og -g2 -ggdb2 but you can change it to debug_build_flags = -O0 -ggdb3 -g3 to apply no optimizations (optimization-level 0 = “do nothing”).

If you upload normally (no debugging) though, it will be built with optimizations. To control the, see build_type = debug.

That one is trickier. Usually for other microcontrollers, like ARM based ones, the debugger is fed a SVD file, which describes the internal hardware registers. One hardware register is then e.g. the current state of the GPIO pins (one for those in output mode, one for those in input mode). When debugging, you can then pause the execution and have a look at that register value to see what the chip sees on one particular pin.

Currently we don’t have a working SVD file so you can’t directly see the register / peripheral information. See current state of the work at Add SVD for ESP32 (wrover kit) by jenswet · Pull Request #325 · platformio/platform-espressif32 · GitHub.

The only way to do this right now would to use the GDB console, to which you also have access to in the PlatformIO unified debugger, and write the command to retrieve (called “examine” in GDB) the memory address where that peripheral register is that holds the input or output state for a certain GPIO bank and pin. See Espressif’s documentation. This requires that you know the ESP32 on a hardware-register level to make sense of the data and know what memory address to readout out, but this is also partly talked in the linked doc.

To make it simple, the register map

Shows that GPIO_OUT_TREG and GPIO_IN_REG as the most important registers. To know the input state of e.g. GPIO3, we read out the GPIO_IN_REG using its address and the GDB command x/4tb 0x3FF4403C , and then look at the 4th bit from the right. (GPIO_IN_REG will describe the 32 pins in a 32-bit value, whereasa the rightmost bit is GPIO0, left to that is GPIO1 etc…). For checking what value a pin is in output mode, use the GPIO_OUT_REG.

I’m not aware of any other addon on top of GDB that gives you a nicer output / window with the pin states.

Thanks very much, I’ll give that a go and check progress on git too.

Oh, on second thought, there might be an easier way that doesn’t go through the GDB console but does the same thing. In the GUI you can add watches for arbitrary expressions.

grafik

So you can use a GDB watch expression there. To e.g. monitor the output state of GPIO0, you would write as the expression

((*(unsigned int*)0x3FF44004) & (1u << 0u)) != 0

That dereferences the GPIO_OUT_REG, ands it with a bitmask to get the bit corresponding to GPIO0 , and then turns it into a boolean true/false value. For different GPIO pins, change the 0u to the GPIO number.

Haven’t tested it, but that should work.

Thanks for the second post Max. I’m not very familiar with the syntax and I’d be grateful if you could trace the expresion for me. Specifically, I’m not sure what the “u” in “1u” is doing. Does it mean unsigned perhaps? But what type is it applied to? When I enter my port number as say 26, Should I also add u, for unsigned?

I’ve tried the flags suggested (-O0 -ggdb3 -g3), but when debugging, it’s still completely skipping the following line: if (0) {Serial.println(String(VPRG_PIN_ans));}, which will never execute of course, but I originally put it in in an effort to to stop the debugger from throwing away my VPRG_PIN_ans variable, which is of type esp_err_t and returned from a call to gpio_set_level(…).

Incedentally, it’s ages since I used pointers and so I can’t decipher your two pointers. I hassen to add, programming isn’t my profession :slightly_smiling_face:

Many thanks.

Hi @2tricky,

Pardon me for jumping in…

Take an address in memory, hexadecimal 3FF44004. This is the (documented?) Address of the GPIO_OUT_REG for the device.

Cast (convert/pretend) to a pointer to an unsigned integer data type.

As it is now pretending to be thevaddress of an unsigned int, dereference it to get the int value.

Perform a bitwise AND operation on the integer value, and using a bit map of “a 1 bit shifted 0 places to the left” – in other words the rightmost bit of the integer value, the least significant bit – to give either a 1 or a 0 result.

Compare with “not zero” to convert into true (the bit was a 1) or false (the bit was a zero).

Tada!

For bit 3, change (1u << 0u) to (1u << 3u).

The ‘u’ makes everything unsigned, as you surmised.

I don’t know if you ever did BASIC as a language? If so, the “cast address to pointer” then dereference to get a values, is simply LET V = PEEK(ADDRESS).

HTH.

Cheers,
Norm.

Thanks for the input Norm, I know some Basic, but not a great deal and so

is not known to me. Though I’m fairly familiar with bit masking, I’m very rusty on pointers.

My projects position is that after tweaking Max’s code - using a int cast, I have a nice column on pin states in the Watch list. I have a number of current intrigues that I’m struggling with, and would appreciate any “input”. They are:

  • Having banged around on the keyboard with efforts like the following:

#define reversed_gpio_get_level(pin) !(boolean)gpio_get_level(pin)

I just can’t get it to reverse the polarity of checking the pins state. I’m trying to do this because I am level shifing between the esp32 and a chip that seems a bit flaky at 3.3V logic, by using a simple NPN transistor - which reverses the logic. The api declaration for this function/macro in gpio.h is:

int gpio_get_level(gpio_num_t gpio_num);

Any ideas what the correct way to do this is? (I’ve tried to use this advice to help - to no avail).

Moving on and further to my interest in the best tracing feedback; how would I present a int (say 26) in say 8 bit binary form (or 32 bit etc) in the Watch window? I’m also wondering how to set a conditional Watch - which just isn’t working for me! My last query on Watches is the scope of the variables to which it has access. For instance, if I have a pin identifier declared as #define MYPIN 26 for instance, I guess I can’t use that and so should also create a persistant variable (I haven’t tried this though).

The good news is that I’m begining to get used to VSC, PlatformIO and debugging with the ESP-prog and have great hopes for the help it will all provide.

Cheers!

Pointers confuse many people. Sometimes they confuse me!

In a nutshell, a pointer holds the location (address) in memory, where something else lives.

When you say int fred;the compiler figures out where a chunk of memory, big enough to hold an int (integer), is located. From now on, every reference to fred will result in something occurring at that address.

Now, a pointer holds an address. That is all it does. Executing int *pfred = &fred; creates a pointer to an int, and initialises it with fred’s address, as worked out by the compiler.

If I now execute fred = 7; I can printf("%d", fred); or equally printf(“%d”, *pfred);` and get 7 both times.

The asterisc says “go to pfred, and get an address, then go to the address and fetch back the value (of an int) that you find there”.

Assuming gpio_get_level(pin) returns a 1 or a zero, “notting” it should reverse it, so make sure it works as straight code first:

int fred;
...
fred = gpio_get_level(pin);
printf("fred = %d\n", fred);

fred=!fred;
printf("!fred = %d\n", fred);

You should see opposites. If your device doesn’t do printf light up an LED or similar.

Once you know it works, you can simply do:

fred = !gpio_get_level(pin);
printf("fred = %d\n", fred);

And see the reversed value of the pin.

Now you can think of setting up a macro. I’d consider more brackets as macros can be iffy at times.

#define reversed_gpio_get_level(pin)  (!(gpio_gel_level((pin))))

The brackets help avoid side effects.

I’ve not used watches in gdb at all to be honest! So, I’m not sure if a #defined macro can be watched, it’s not going to change by its very nature.

It seems that in “raw” command line gdb, watches can be displayed in hex as “variable_name,h” (no spaces?) I assume binary woulf be comma b. However, this link vscode debugger - How to display the hex value in the Watch panel of VS Code? - Stack Overflow seems to imply that it doesn’t work in vscode.

:frowning:

Cheers,
Norm.

Thanks Norm and apologies for the wait. You are of course right about define not being appropriate.

The prologue: I have had a different problem each day. Max gave a link to a page that “defines” how GBC allows you to set breakpoints but I have had no luck.

I have one conditional breakpoint work for ten that don’t - and I don’t know why. There is no feedback in the console from what I can see - to give insight. Tonight, my debugging has hot a brick wall. It wont run at all. There was a message in the Debug Console:

“A problem internal to GDB has been detected,
further debugging may prove unreliable. Create a core file of GDB? (y or n) [answered Y; input not from terminal]”

Incedentally, I can’t enter any text into the terminal, despite an inviting single line box. You might notice that the code writer even confuses lower case with upper.

Sometimes, my installation ignores enabled breakpoints and can stop on disabled breakpoints. I can find no documentation of what “Clean” does, which I’ve used numerous times without evidence that it cleans effectively. I have peramaters to functions/procedures that intellisense offers and which are logical, but which don’t compile ultimately. Of course this software is free and so I can’t complain.

Tomorrow is another day - but so was today - earlier on.

No worries, no apology necessary.

If you google that, with ESP32 tagged on, you get quite a few hits. Does this give you anything you recognise? A problem internal to GDB has been detected esp32 - Google Suche

Failing that, what device are you coding for? What debugger are you using? Are you able to post your zipped up project somewhere – assuming non-confidential – like Dropbox, Google Drive etc?

I’ve got a few microcontrollers around including an Espressif D1 mini, so maybe I can recreate your problem?

Cheers,
Norm.

Norm; I took a look and no, not really, although there were many different scenarios. My issue seemed/seems different.

Anyway, I persevered and got it back. Oddly, my Win 10 configuration now shows just one COM port in Device Manager and one Dual RS232-HS entry - which I understand is the correct way. I had it working before with two Dual RS232-HS entries. It seems a little more stable now - though it still has problems. My setup always grumbles about the JSON files… Either it doesn’t like comments in them or it can’t find files listed in JSON and this only scratches the surface really. It always finds something new to be upset about.

I still can’t reliably set anything accept standard breakpoints. I managed a conditional breakpoint that worked just once, and so think I have the right syntax, but I haven’t been able to set either conditonal, log or hit types since, and this is frustrating.

Anyway; I made progress and have a new problem - but I don’t know whether I should add it here or start a new thread…

This is a very strange problem; I am trying to push bits into a shift register and as part of my troubleshooting of strange behaviour am reading those shifted bits as they leave the shift register and inserting them into an array - yet they are not going into the correct element. For instance, the bits can be about 3 or 4 positions out. Adjusting the position of where they go works for a given set of data only, but change the data and the error changes too. So I’m wondering whether the compiler is responsible. Is there maybe a command that tells the compiler to not do this? Does “gpio_get_level(pin)” or “digitalRead(pin)” not block maybe…? An irony is that it is putting it into the array early - at a lower element position (I don’t think there is a chance that the insertions are almost a whole array late). I’m reading about 38,000 bits per second and adding a delay after the call doesn’t change the error.

Thanks a lot!

That’s a shame. I really don’t have anything more to suggest, sorry. :frowning_face:

As far as I’m aware, JSON doesn’t allow comments. JSON so if something is complaining, it’s valid!

I wonder if you might be shifting out from the wrong end? Are you shifting out most significant bit first, but shifting in least significant bit first? Clutching at straws I admit, but you never know.

Ah! Hang on! …

No they do not block. They return the pin state as it is right now. If you are calling gpio_get_level() to read the state of a pin then you’ll need some method of synchronising the speed you are reading the pin with the rate at which the pin is changing.

If the pin takes on a new state 30,000 times a secind, but you read 38,000 times a second, you will be out of sync very quickly and will have read the same bit state multiple times. Your code would be reading 1.266…6 bits per pin state change.

The Arduino framework supplies the shiftIn() function:

uint8_t shiftIn(uint8_t dataPin, uint8_t clockPin, uint8_t bitOrder) 

Which reads the state on the data pin, but is clocked by the clock pin to synchronise. The bitOrder simply says MS bit or LS bit first. The clock pin goes high when the Arduino is ready to shift in the next bit, and low to prevent the sender sending more bits while the Arduino isn’t ready for them:

uint8_t shiftIn(uint8_t dataPin, uint8_t clockPin, uint8_t bitOrder) { 
    uint8_t value = 0; 
    uint8_t i; 

    for (i = 0; i < 8; ++i) { 
        digitalWrite(clockPin, HIGH);                   
        if (bitOrder == LSBFIRST) 
            value |= digitalRead(dataPin) << i;          
        else 
            value |= digitalRead(dataPin) << (7  - i);  
  
        digitalWrite(clockPin,   LOW);
    }
    return value;
}

I wonder if you need something similar?

Cheers,
Norm.

At the moment the code is all in a simple loop - until I start to shift in by using SPI and also create a clock pulse from a timer for PWM of the outputs and so the donor array is shifting in at the exact same rate (suppossedly) as the array that being filled is populating. This shift register can cope with 30MHz and so I’m sure I’m within its scope. I need speed though and so am sensing that as the functions don’t block, that is a good place to start to look for latency. I’m shifting in the most significant bit first and have create a non symetrical data set so that I can tell where it is relatively as a whole.

Thanks for coming back so soon and I’ll keep plugging away.

Cheers!

Sounds like fun! The external device that you are reading from, I assume it’s clocked? If not then I think this might be where the problem could lie.

Which device is it? Is there a data sheet? I’m intrigued by this problem!

Well, I don’t know about gpio_get_level() but I know a lot about digitalRead() for the Arduino. If you need speed, avoid!

digitalRead() does a whole lot of work in the background to make life easy before getting down to a simple value = PINx which is a simple register read to get an 8 bit value and executes in one (ATmega328xx) clock cycle at 16MHz.

I imagine that if you are using the Arduino framework for the ESP32 then there might be a layer of software on top of the normal ESP32 layer, to emulate the digitalRead() call, slowing things down even further.

Have fun.

Cheers,
Norm.

Agreed. I’m quite used to direct port stuff on the Arduino and hense my comfort with bit masks - mainly to avoid the overheads of such functions. However, this first ESP32 effort was only to prove an approach in a brand new IDE and with a brand new processor - until I can move on with confidence. The external chip is not self governing and relies upon pulses from the ESP32 or whatever and so the devices should be in sync - everything being equal. It’s a very strange feeling to put something into myArray[60] and find it in myArray[56] and I am pinning my hopes on the OS being to blame. I have some digging to do.

:slight_smile:

Stupid question. I assume that if you write a set of values manually into the array, you get them in the correct place?

Cheers,
Norm.

No, not stupid at all. It’s a curiosity that I get perfect “normal” results transffering from one array to another within that same loop as the pin read.

No interrupts, or interrupt handlers affecting the arry index?

Using the array index variable elsewhere, globally?

Wondering! :wink:

Cheers,
Norm.

No, nothing fancy at all yet. No tasks, no core selection, and I haven’t had to add any libraries either - just Arduino.h. Not getting anywhere with Googling yet!

Update:

A day has gone past and I’m suffering the dreadful impasse again where the debugging reports:

“A problem internal to GDB has been detected,
further debugging may prove unreliable. Create a core file of GDB? (y or n) [answered Y; input not from terminal]”

Last time it was fixed after reinstalling VSC and Python, but I’m loathed to make that a habit. I need to find the reason really and have no clue where to start.

I’ll post on the expresif site to see if I can home in on a solution of sorts.

Many thanks again.

Can you post your code somewhere? If permitted of course. I can see if I can replicate the problem – assuming I have a suitable device.

Cheers,
Norm.