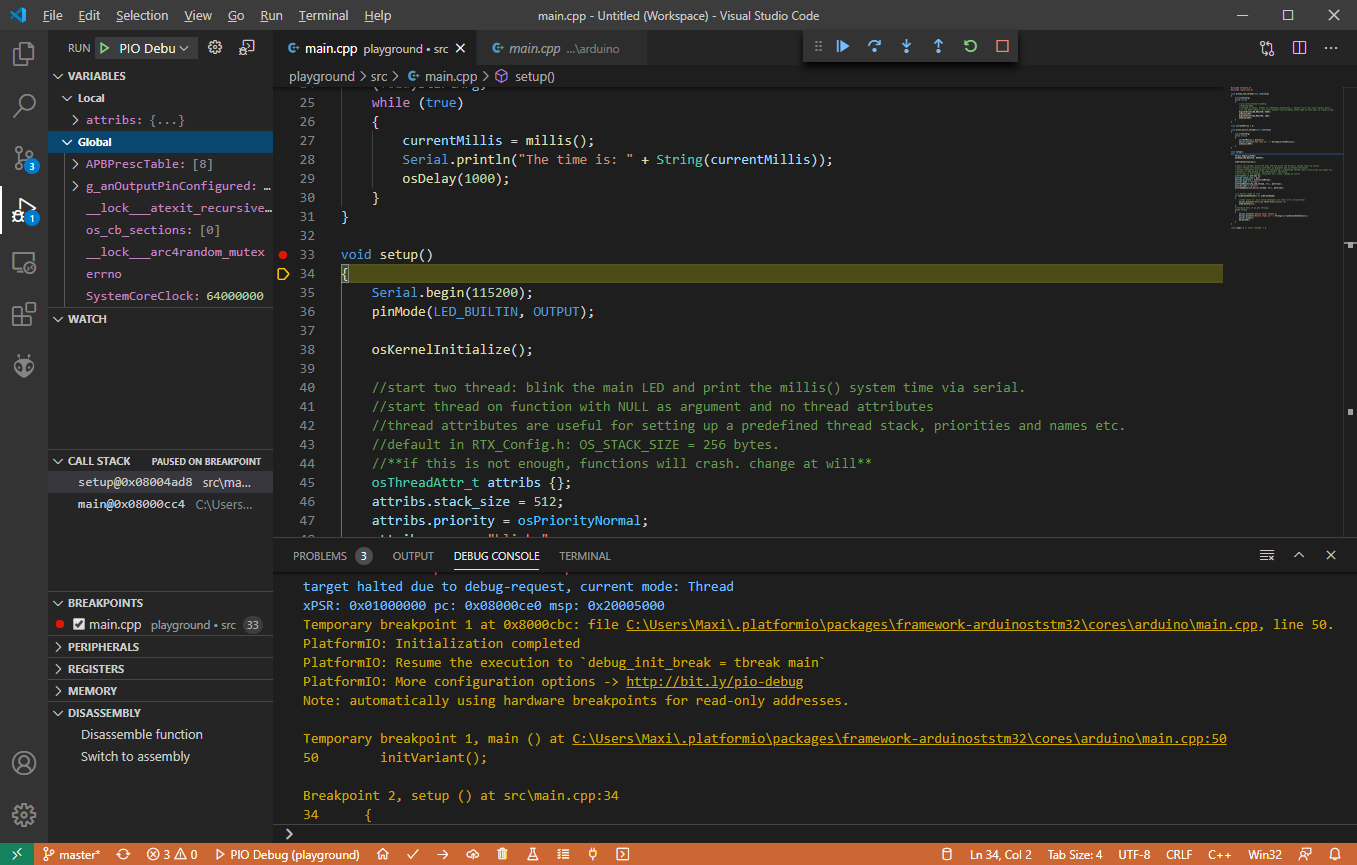
I managed to get the debugger up and running with the esp-rog JTAG debugger. I am quite happy, except with the Global Variables window (in the upper left part of the screen)
When I expand the “global” heading, a bunch of variables is display, and it makes it very difficult to locate the global variables of my program. Is there a FINS command available? Or can those not-my-own-programs global variables be hidden somehow?
I am using Window 10 (1909), PlatformIO 4.2.1, and Visual Studio Code 1.42.1
I met the same problem.
What does that mean? Do you mean the global variable was there and VS Code just didn’t show it ?
Then, how to observe the globe variable during debugging ?
When I debugging UNO, I found that, the code on board run itself, no matter I set breakpoint or not. That is to say, my debugging operation - “step xxx” doesn’t control the process on board.
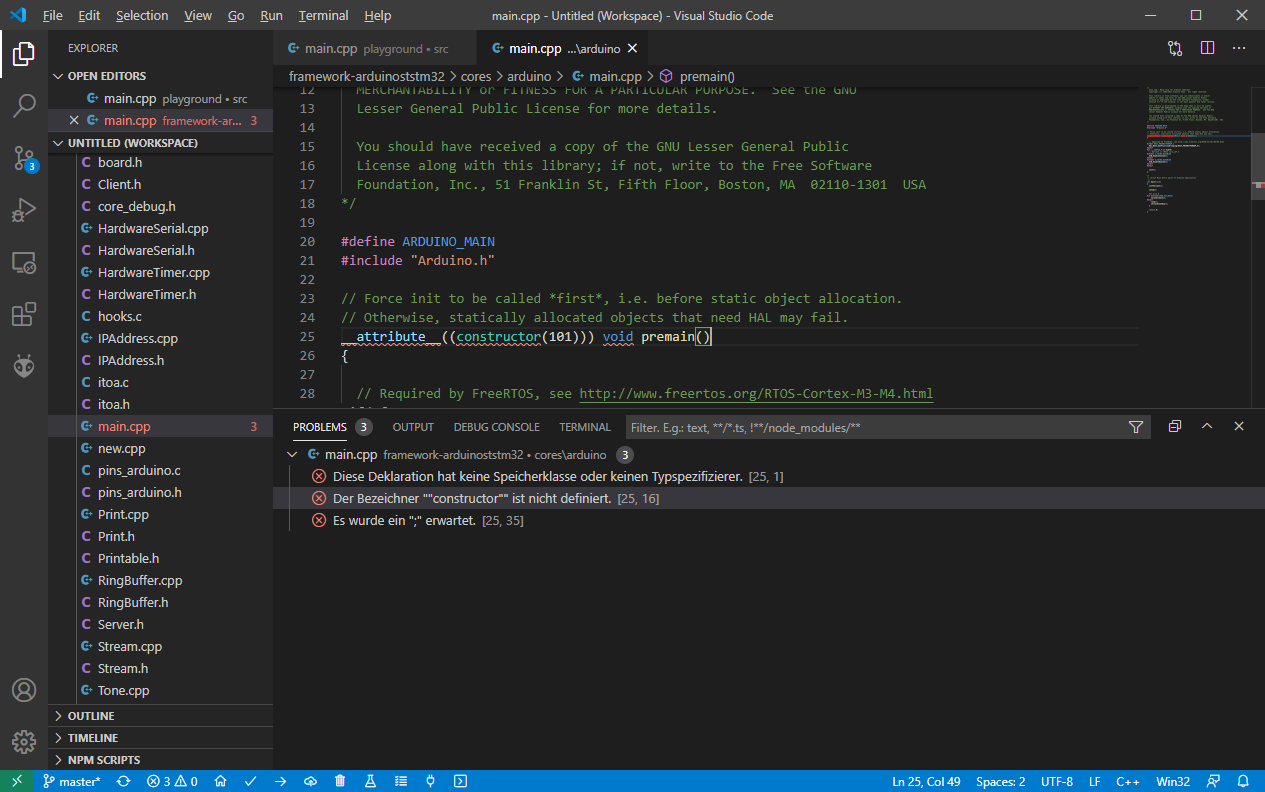
They are irrelevant to debugging because these are not compile errors. VSCode’s C++ Intellisense thinks these are C++ errors when they actually arent; it just cannot comprehend the code correctly.
In this case it doesn’t understand GCC’s __attribute__((constructor(101))). Since it compiles, it can be debugged, so that has nothing to do with being able to see variables in the debugger.
Well, that documentation and repository are very old and shouldn’t be used as a reference anymore, so better use the official repository. Also, the version of simavr that PlatformIO includes is based on that repository plus a couple of mods from my fork.
@maxgerhardt
It is possible to debug a real Arduino board even without an external debugger circuit through the avr_debug library. Also, I already got experimental support for the mentioned library into my fork of the atmelavr platform and probably will create a PR in the following days
There is no need to compile or install the ubuntu version, PlatformIO already comes with its own binaries. You only need to press F5 to start the debug session and it will also install the simavr package if it wasn’t already installed.
It seemed that, platformIO could run itself, so what’s the function of VS Code ?
I saw even in the homepage of https://platformio .org, it was recommended that VS Code be installed first, if I haven’t installed VS Code, what would happen ? could I also debug Arduino UNO project in it ?