I have a Nucleo board, but it’s not the same as yours, mine’s a F103RB. However, I’ve never got around to playing with it in PlatformIO (or Arduino) so I created a new project and added most of your platformio.ini and your main.cpp.
When I enter debuging using F5, I get a breakpoint in main. I can set other breakpoints and step through/over various lines of code without problems. I can see variables but obviously only when they are in scope.
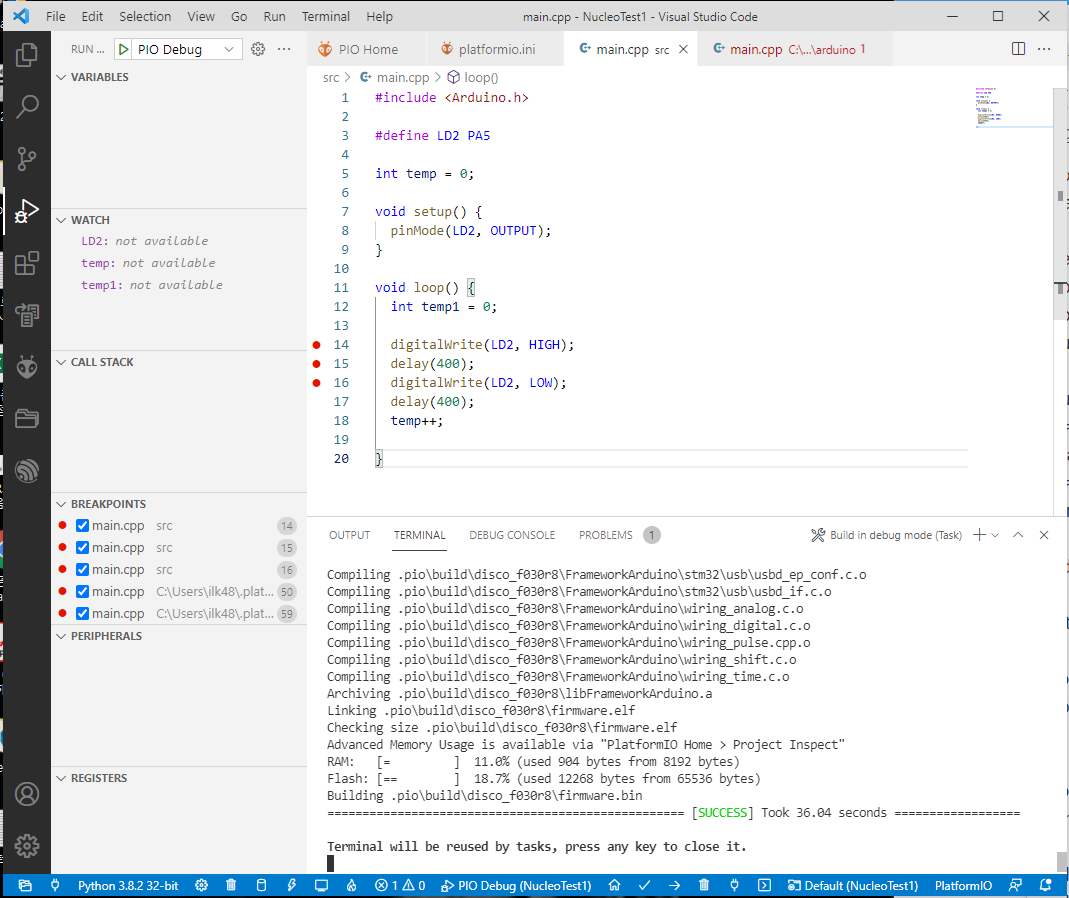
Looking at your screen shot, I’m not seeing a debug toolbar anywhere, which make @maxgerhardt’s observation that debugging hasn’t started very relevant. When debugging there’s a toolbar with a few buttons on it to step over, step into, continue and stop etc. Your screen isn’t showing that.
If you switch to the other tab in VSCode that’s showing the main.ccp 1 title in a reddish brown text colour (there’s a ‘1’ suffix and a path on the tab’s title too), can you debug there? When I’m debugging it’s that window that’s the active debug window and not the main.cpp tab.
Each of those options starts a debugging session for me, and opens a new source window onto main.cpp initially, but as I step into various lines of code, it changes the windo to be the source file that the function I’m stepping through, is located in.
I think you are looking at your source code file and not the actual debugging session’s view of your source file. I think you have clicked off the debug tab onto your own file. I can reproduce your screen here just by doing that.
Checking size .pio\build\disco_f030r8\firmware.elf
Advanced Memory Usage is available via “PlatformIO Home > Project Inspect”
RAM: [== ] 15.0% (used 1232 bytes from 8192 bytes)
Flash: [=== ] 29.7% (used 19464 bytes from 65536 bytes)
========================= [SUCCESS] Took 4.80 seconds =========================
undefinedError: Traceback (most recent call last):
File “c:\users\ilk48.platformio\penv\lib\site-packages\platformio_main_.py”, line 109, in main
cli() # pylint: disable=no-value-for-parameter
File “c:\users\ilk48.platformio\penv\lib\site-packages\click\core.py”, line 829, in call
return self.main(*args, **kwargs)
File “c:\users\ilk48.platformio\penv\lib\site-packages\click\core.py”, line 782, in main
rv = self.invoke(ctx)
File “c:\users\ilk48.platformio\penv\lib\site-packages\platformio\commands_init_.py”, line 44, in invoke
return super(PlatformioCLI, self).invoke(ctx)
File “c:\users\ilk48.platformio\penv\lib\site-packages\click\core.py”, line 1259, in invoke
return _process_result(sub_ctx.command.invoke(sub_ctx))
File “c:\users\ilk48.platformio\penv\lib\site-packages\click\core.py”, line 1066, in invoke
It will appear in the debug console as above.
It will appear in the debug console as above.
I ran this command: pip install -U platformio
But the problem is the same.
As you said, the toolbar is not visible.
However, the toolbar is visible while compiling and uploading, and disappears when finished.
It is downloaded, but it is suspected that communication for debugging is not possible.