Hi, everyone.
I know this is debugger related but, I wanted to reach out to the widest community to establish if the high cpu usage I’m experiencing while using the debugger is typical, or not?
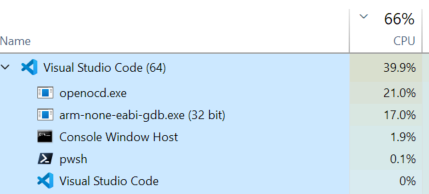
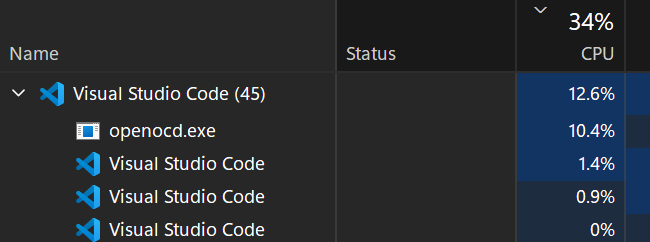
When I run the debugger, my cpu usage rises to 25% and the fan kicks in; when I stop debugging the fan persists until the cpu has cooled down. The culpret is
. Has anyone observed such behaviour?Also, there are delays when the debugger opens up, configues itself and is used, which are much longer than I’ve experience with other technologies. Again I’m enquiring if this behaviour is typical.
Specifically
- On opening the debugger it takes ~4 seconds to load i.e. to get to
Terminal will be reused by tasks, press any key to close it.
-
A further 12 seconds to get to the stage where a tempory breakpoint has be logged and debugging can begin.
-
Approximately 4 seconds for the variables to be updated in the variables window, each and every time the program “Breaks” at a break point.
If these performance metrics are typical, OK. But that said I don’t believe my machine should be throttling so hard. Does anyone have any suggestions to improve matters.
Many thanks
Greg
 .
.