For reference, here’s the output of the debug console:
undefinedC:\Users\matth\.platformio\packages\toolchain-xtensa-esp32\bin\xtensa-esp32-elf-gdb.exe: warning: Couldn't determine a path for the index cache directory.
Reading symbols from c:\Users\matth\Documents\PlatformIO\Projects\220926-220907-arduino-blink\.pio\build\esp32dev\firmware.elf...
PlatformIO Unified Debugger -> https://bit.ly/pio-debug
PlatformIO: debug_tool = esp-prog
PlatformIO: Initializing remote target...
Open On-Chip Debugger v0.11.0-esp32-20220706 (2022-07-06-15:48)
Licensed under GNU GPL v2
For bug reports, read
http://openocd.org/doc/doxygen/bugs.html
adapter speed: 20000 kHz
WARNING: boards/esp-wroom-32.cfg is deprecated, and may be removed in a future release.
DEPRECATED! use 'adapter speed' not 'adapter_khz'
adapter speed: 5000 kHz
Info : tcl server disabled
Info : telnet server disabled
Info : clock speed 5000 kHz
Error: JTAG scan chain interrogation failed: all zeroes
Error: Check JTAG interface, timings, target power, etc.
Error: Trying to use configured scan chain anyway...
Error: esp32.cpu0: IR capture error; saw 0x00 not 0x01
Warn : Bypassing JTAG setup events due to errors
Error: Unexpected OCD_ID = 00000000
Warn : target esp32.cpu0 examination failed
Error: Unexpected OCD_ID = 00000000
Warn : target esp32.cpu1 examination failed
Info : starting gdb server for esp32.cpu0 on pipe
Info : accepting 'gdb' connection from pipe
Error: Target not examined yet
Error executing event gdb-attach on target esp32.cpu0:
Warn : No symbols for FreeRTOS!
Error: Target not halted
Error: auto_probe failed
Error: Connect failed. Consider setting up a gdb-attach event for the target to prepare target for GDB connect, or use 'gdb_memory_map disable'.
Error: attempted 'gdb' connection rejected
Error: error during select: Unknown error
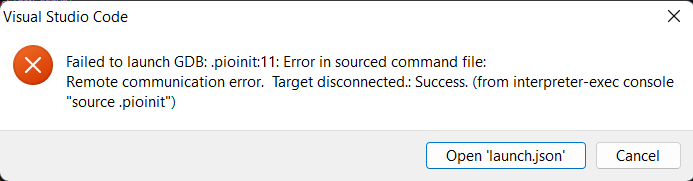
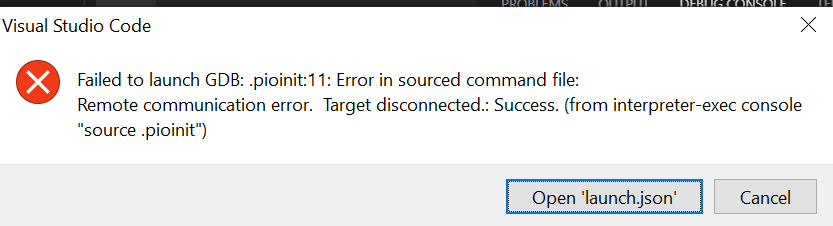
.pioinit:11: Error in sourced command file:
Remote communication error. Target disconnected.: Success.
Here’s the platform.ini file:
; PlatformIO Project Configuration File
;upload_port = COM4
;
;   Build options: build flags, source filter
;   Upload options: custom upload port, speed and extra flags
;   Library options: dependencies, extra library storages
;   Advanced options: extra scripting
;
; Please visit documentation for the other options and examples
; https://docs.platformio.org/page/projectconf.html

[env:esp32dev]
platform = espressif32
framework = arduino
board = esp32dev
monitor_speed = 115200
build_flags =
	-D LED_BUILTIN=2
lib_deps = madhephaestus/ESP32Servo@^0.11.0

debug_tool = esp-prog
debug_init_break = tbreak setup
I am using the default blink.cpp file:
/*
 * Blink
 * Turns on an LED on for one second,
 * then off for one second, repeatedly.
 */

#include <Arduino.h>


// Set LED_BUILTIN if it is not defined by Arduino framework
#ifndef LED_BUILTIN
    #define LED_BUILTIN 2
#endif


void setup()
{
  // initialize LED digital pin as an output.
  pinMode(LED_BUILTIN, OUTPUT);
}

int delayTime = 1000;

void loop()
{
  // turn the LED on (HIGH is the voltage level)
  digitalWrite(LED_BUILTIN, HIGH);
  // wait for a second
  delay(delayTime);
  // turn the LED off by making the voltage LOW
  digitalWrite(LED_BUILTIN, LOW);
   // wait for a second
  delay(delayTime);
}
The build succeeds and I can even flash the code to the esp32 but for some reason, I keep getting this same error message. I tried reinstalling the driver using Zadig and then using a different USB driver software just in case Zadig didn’t work. Then I proceeded to replace all the wires and double-check the connections and I still got the same error. In case this wasn’t clear, I’m using VScode with the platformIO plugin and starting debugging through the run bar at the top of the editor. Please help! Thanks!
I had the same wire setup as provided in the link. The only difference was I was connected to a different ground wire and I also had a 3.3V connection between the esp and the debugger. Regardless, I just removed the 3.3V connection and connected ground to the same exact pin shown on the website you provided. Again, I got the same error as before:
undefinedC:\Users\matth\.platformio\packages\toolchain-xtensa-esp32\bin\xtensa-esp32-elf-gdb.exe: warning: Couldn't determine a path for the index cache directory.

Reading symbols from c:\Users\matth\Documents\PlatformIO\Projects\220926-220907-arduino-blink\.pio\build\esp32dev\firmware.elf...
PlatformIO Unified Debugger -> https://bit.ly/pio-debug
PlatformIO: debug_tool = esp-prog
PlatformIO: Initializing remote target...
Open On-Chip Debugger  v0.11.0-esp32-20220706 (2022-07-06-15:48)
Licensed under GNU GPL v2
For bug reports, read
	http://openocd.org/doc/doxygen/bugs.html
adapter speed: 20000 kHz

WARNING: boards/esp-wroom-32.cfg is deprecated, and may be removed in a future release.
DEPRECATED! use 'adapter speed' not 'adapter_khz'
adapter speed: 500 kHz

Info : tcl server disabled
Info : telnet server disabled
Info : clock speed 500 kHz
Error: JTAG scan chain interrogation failed: all zeroes
Error: Check JTAG interface, timings, target power, etc.
Error: Trying to use configured scan chain anyway...
Error: esp32.cpu0: IR capture error; saw 0x00 not 0x01
Warn : Bypassing JTAG setup events due to errors
Error: Unexpected OCD_ID = 00000000
Warn : target esp32.cpu0 examination failed
Error: Unexpected OCD_ID = 00000000
Warn : target esp32.cpu1 examination failed
Info : starting gdb server for esp32.cpu0 on pipe
Info : accepting 'gdb' connection from pipe
Error: Target not examined yet
Error executing event gdb-attach on target esp32.cpu0:

Warn : No symbols for FreeRTOS!
Error: Target not halted
Error: auto_probe failed
Error: Connect failed. Consider setting up a gdb-attach event for the target to prepare target for GDB connect, or use 'gdb_memory_map disable'.
Error: attempted 'gdb' connection rejected
Error: error during select: Unknown error
.pioinit:11: Error in sourced command file:
Remote communication error.  Target disconnected.: Success.
The following are pictures of my setup (initially I was using a breadboard but I decided to opt for female to female wires to make matters simpler). Also, I just checked continuity with a multimeter between the pins on my esp and the debugger and the wires all work: IMG_1684.HEIC IMG_1685.HEIC IMG_1686.HEIC IMG_1687.HEIC IMG_1688.HEIC IMG_1683.HEIC
Do you have any other ideas on why it may not be working? Thanks!
All wiring connections look good, but you also then use a microusb cable for the ESP32 dev board to power it, yes? I’ve heard of problems trying to power it from the ESP-Prog’s 3.3V output.
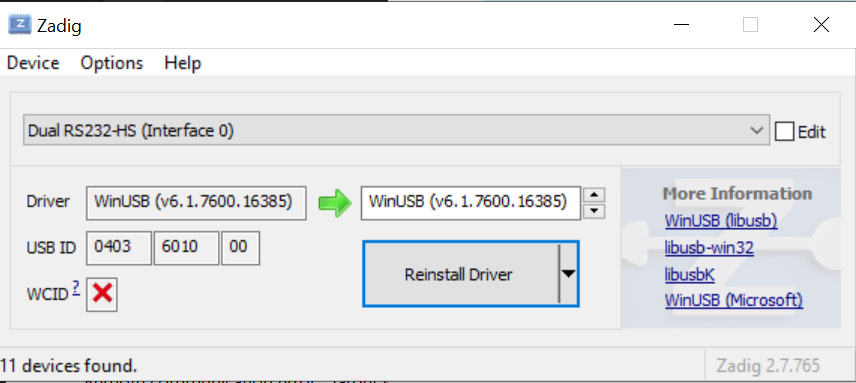
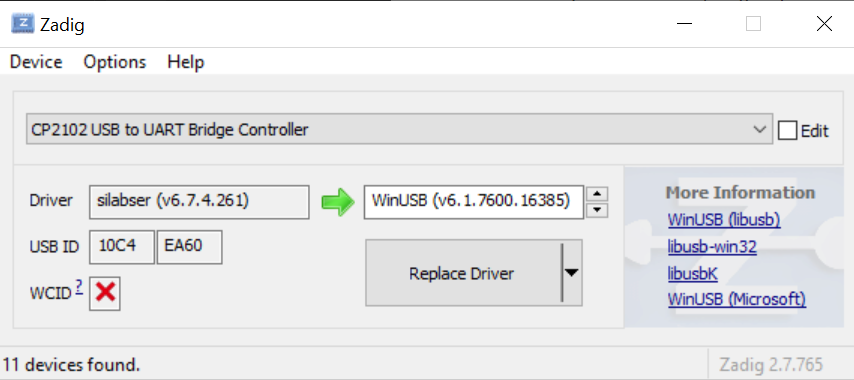
Yes, I have a MicroUSB cable connected from the esp to my computer and a MicroUSB cable connected from my debugger to my laptop. When I flash my esp, however, I disconnect the debugger from my esp (as this has resulted in problems) and I proceed to upload code. Then I reconnect the debugger and I start debugging from the run dropdown at the top of VSCode. I also changed the driver type of the debugger on both my COMPorts from the hs232 interface to a lib USB interface using Zadig and another USB driver installer just to make sure. Any idea on where to go from here?
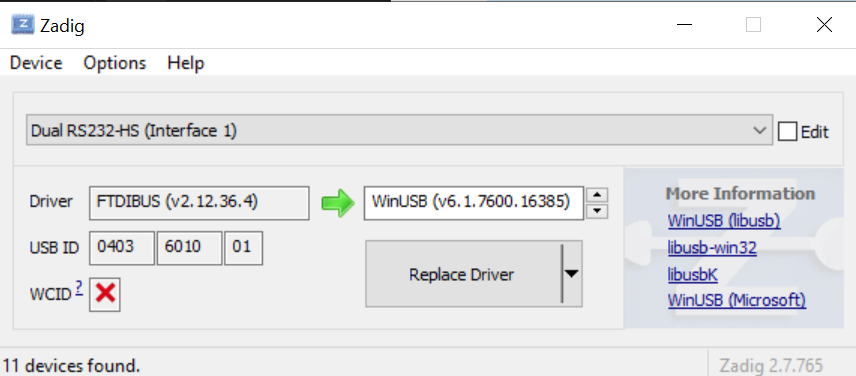
well this may be wrong, if you convert both UARTs to a libusb device, it may be picking the FTDI channel that is going to the UART header where nothing is connected. Can you only try one?
Yes I think that may have been the issue. I should have only picked hs232 on interface 0 but I did it on both interfaces so I lost the FTDI driver on interface 1 of the debugger. I was only able to figure this out by using a different computer altogether. It would be nice though if I were able to set it it up on my laptop as well. Do you know if there’s a way to reset the driver. I tried uninstalling it from device manager and the using Zadig again to change the interface 0 driver but I get a pioinit 11 error again.
@maxgerhardt Sorry to bother you once more but as I was using the debugger in a different project (on the same PC that worked before), I got another pioinit 11 error and I do not know what I am doing incorrectly. I tried reducing the debugging speed to 200 but that did not make a difference. I am sure that all my connections are correct because I tried out the debugger on a simple blinkey.cpp file and it works. However, when I try using the debugger on a bigger project, it stops working and I do not know why.
Here is the output I am getting from the debug console:
undefinedC:\Users\edwar\.platformio\packages\toolchain-xtensa-esp32\bin\xtensa-esp32-elf-gdb.exe: warning: Couldn't determine a path for the index cache directory.

Reading symbols from c:\Users\edwar\Documents\MatthewsDevEnv\platformIOComposter-main\.pio\build\az-delivery-devkit-v4\firmware.elf...
PlatformIO Unified Debugger -> https://bit.ly/pio-debug
PlatformIO: debug_tool = esp-prog
PlatformIO: Initializing remote target...
Open On-Chip Debugger  v0.11.0-esp32-20220706 (2022-07-06-15:48)
Licensed under GNU GPL v2
For bug reports, read
	http://openocd.org/doc/doxygen/bugs.html
adapter speed: 20000 kHz

WARNING: boards/esp-wroom-32.cfg is deprecated, and may be removed in a future release.
adapter speed: 200 kHz

Info : tcl server disabled
Info : telnet server disabled
Error: libusb_open() failed with LIBUSB_ERROR_NOT_SUPPORTED
Info : clock speed 200 kHz
Error: JTAG scan chain interrogation failed: all zeroes
Error: Check JTAG interface, timings, target power, etc.
Error: Trying to use configured scan chain anyway...
Error: esp32.cpu0: IR capture error; saw 0x00 not 0x01
Warn : Bypassing JTAG setup events due to errors
Error: Unexpected OCD_ID = 00000000
Warn : target esp32.cpu0 examination failed
Error: Unexpected OCD_ID = 00000000
Warn : target esp32.cpu1 examination failed
Info : starting gdb server for esp32.cpu0 on pipe
Info : accepting 'gdb' connection from pipe
Error: Target not examined yet
Error executing event gdb-attach on target esp32.cpu0:

Warn : No symbols for FreeRTOS!
Error: Target not halted
Error: auto_probe failed
Error: Connect failed. Consider setting up a gdb-attach event for the target to prepare target for GDB connect, or use 'gdb_memory_map disable'.
Error: attempted 'gdb' connection rejected
Error: error during select: Unknown error
.pioinit:11: Error in sourced command file:
Remote communication error.  Target disconnected.: Success.
However, I don’t think I need to replace any of my drivers because again the debugger works on my blinkey.cpp file. I don’t understand why it’s not working on my larger project (it worked like 1 time on the larger project but it froze in the middle of void_setup() and stopped working - it’s very finnicky)
@matthewgerges - Hi, Unfrtunately i also ran into this same problem. My use case is also exactly the same. It will be very hepful to me if you could post the solution in case you have found one.
Thanks.