Dear Community,
I have a strange issue while trying to debug a Pi Pico. I am using the Raspberry Pi Debug Probe on PlatformIO in VSCode on MacOS.
The code is an empty Arduino sketch (setup/loop empty).
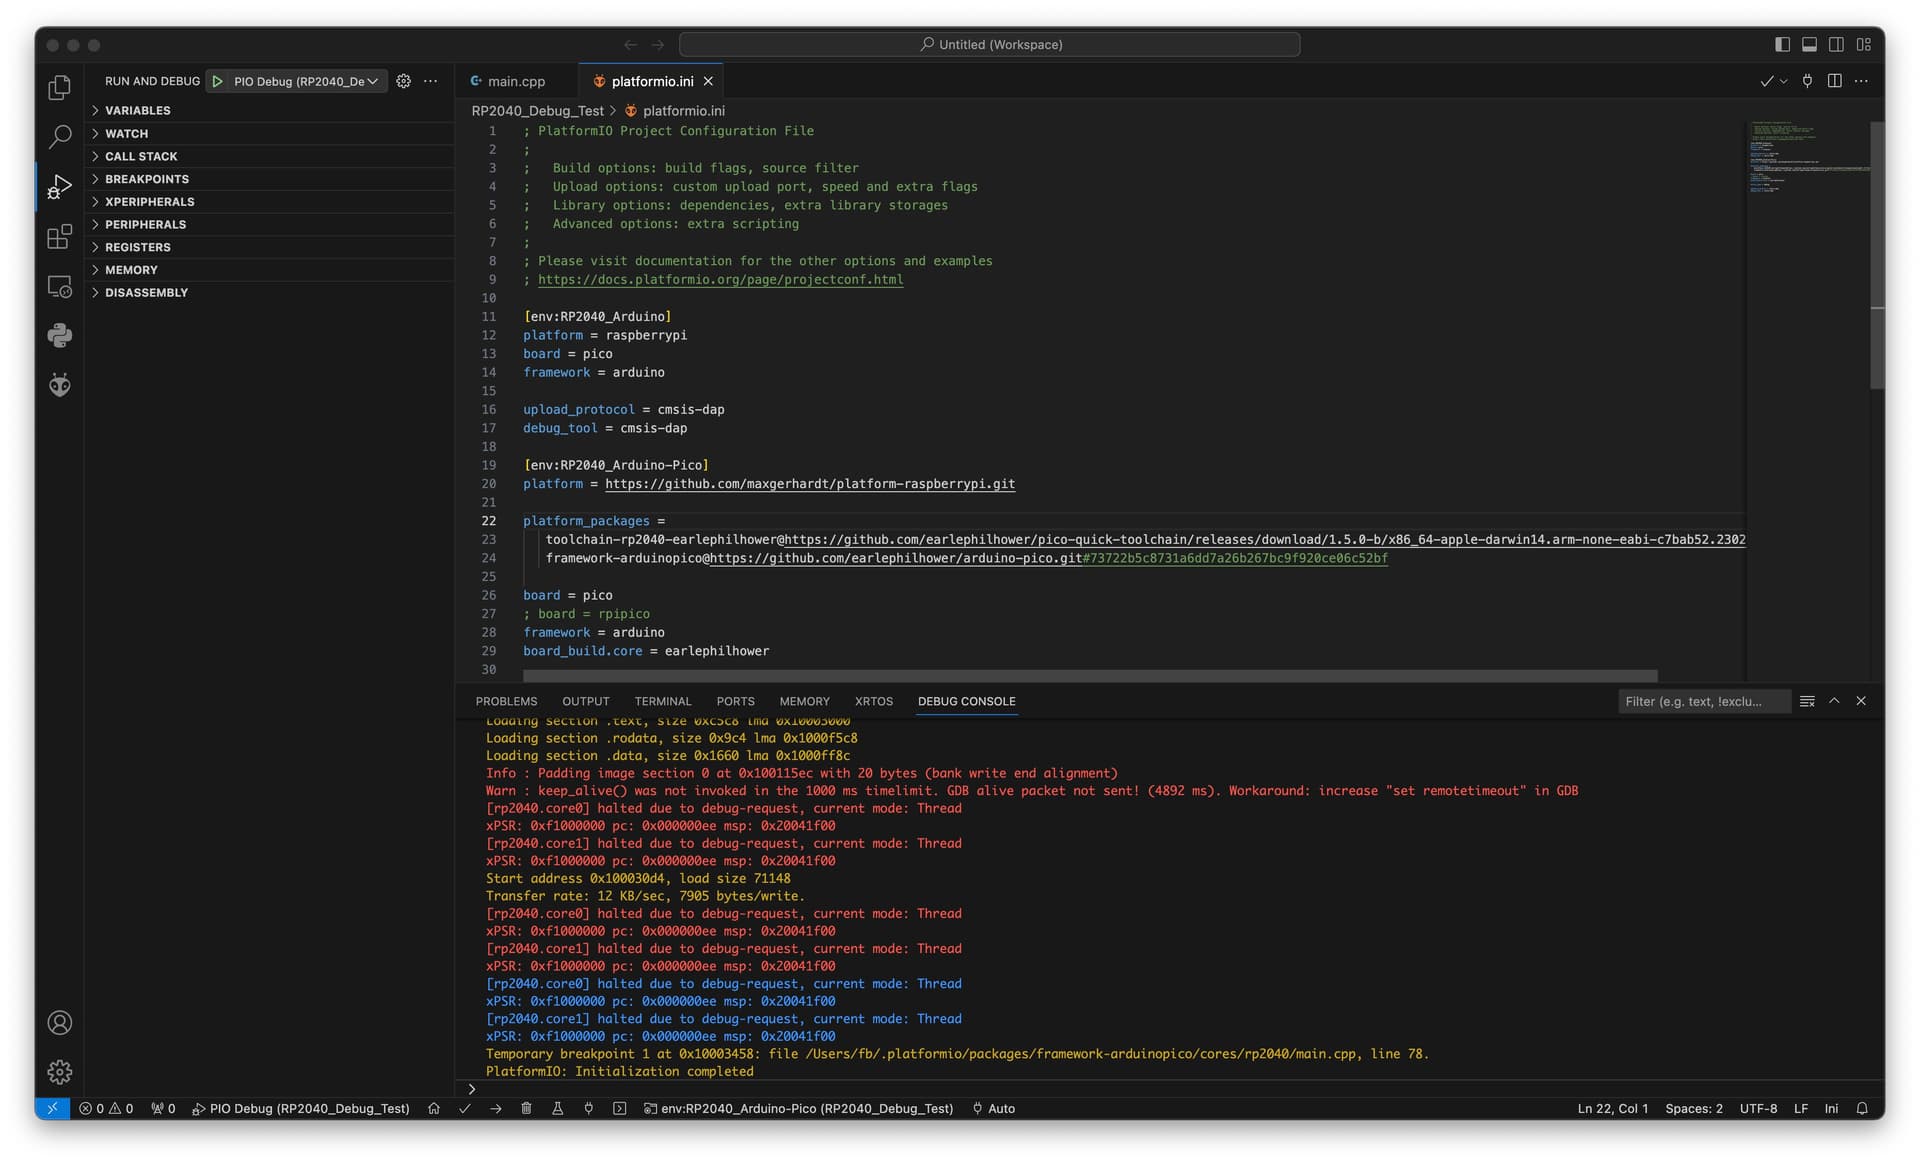
The platformio.ini used is:
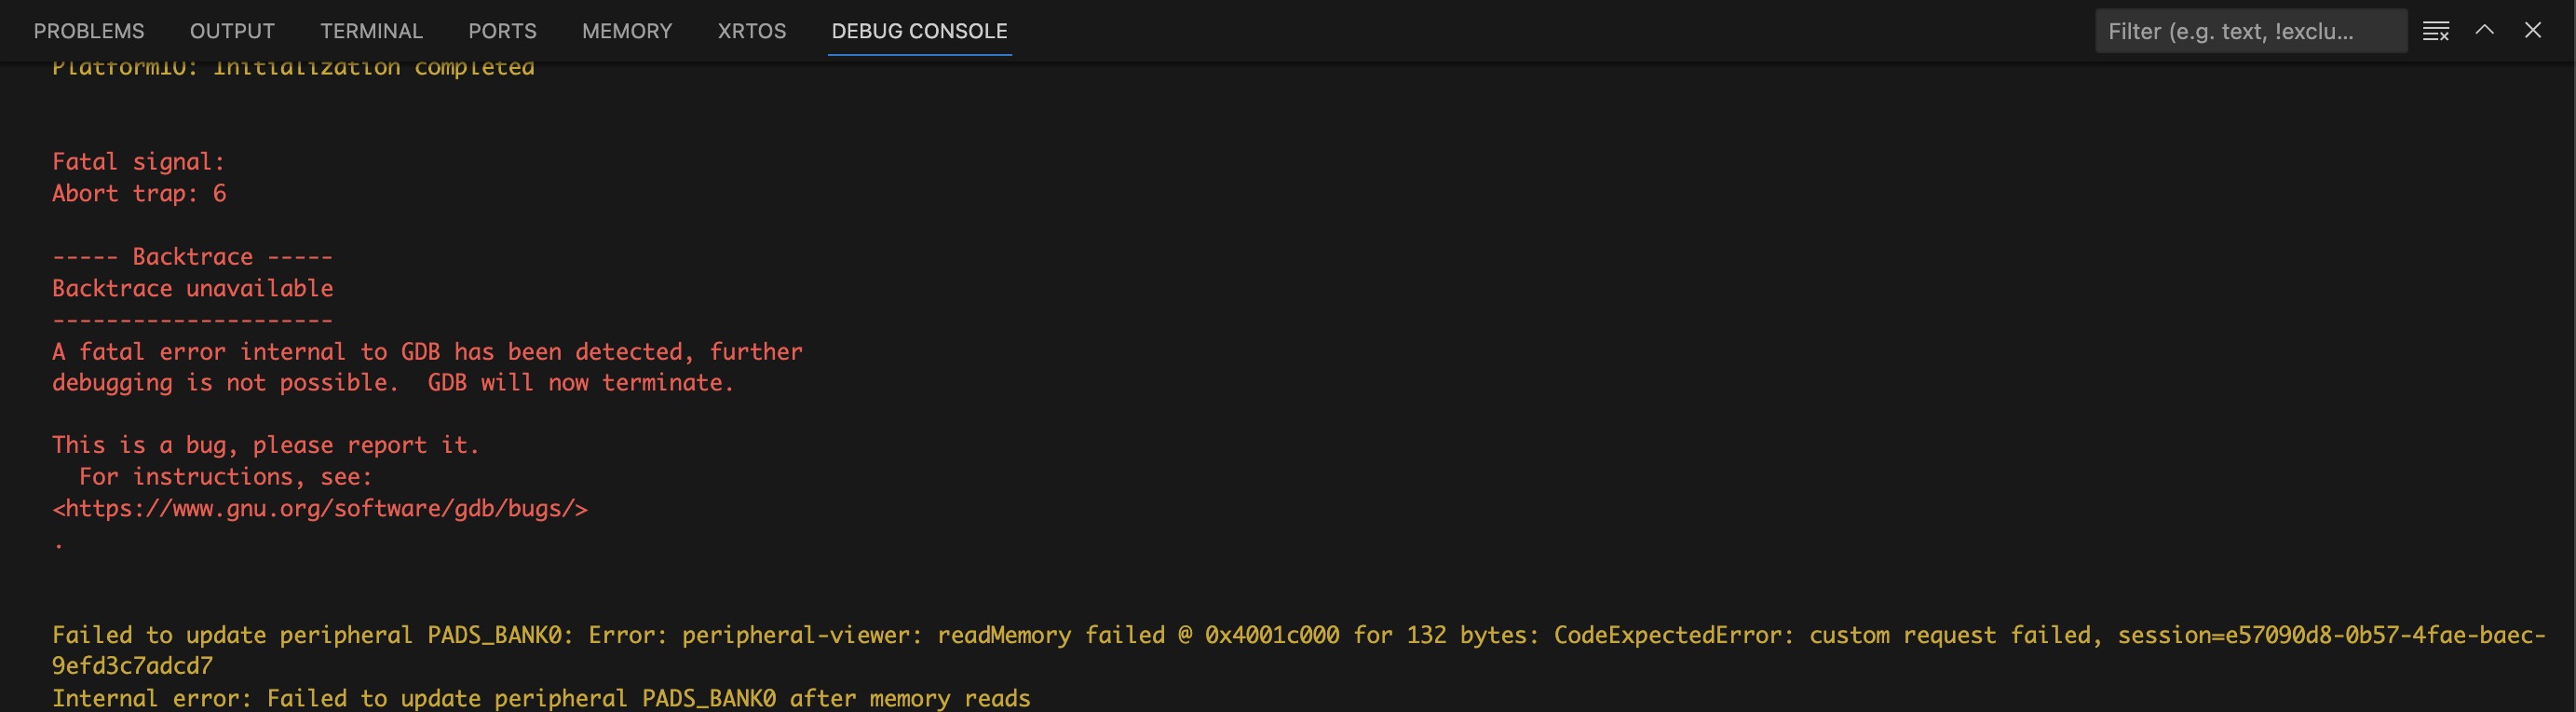
Uploading with the Raspberry Pi Debug Probe works with both cores. However, a problem arises when trying to debug. With the Arduino core, debugging works as expected. When trying to debug using the Arduino-Pico core, gdb encounters an error:
Following other Pico debugging posts, I already deleted .platformio/.cache, .platformio/packages/toolchain-rp2040-earlephilhower and .platformio/platforms/raspberrypi. They redownloaded just fine, but the issue persists.
Since Arduino-Pico includes the Pico C SDK I would greatly prefer to use this core to have access to all the SDK functions, but I still need debugging capabilities.
Any help with that is greatly appreciated. Thanks.
Did you have the “Perpiherals” view expanded or are using additional extensions besides PlatformIO, C/C++ by Microsoft and Python? I think something is triggering th eread to PADS_BANK0.
Thank you for the quick reply… I did not find the issue you linked when looking prior. Probably because I was just looking for cmsis-dap.
Using the toolchain and framework versions mentioned in the post changes the output. See the picture:
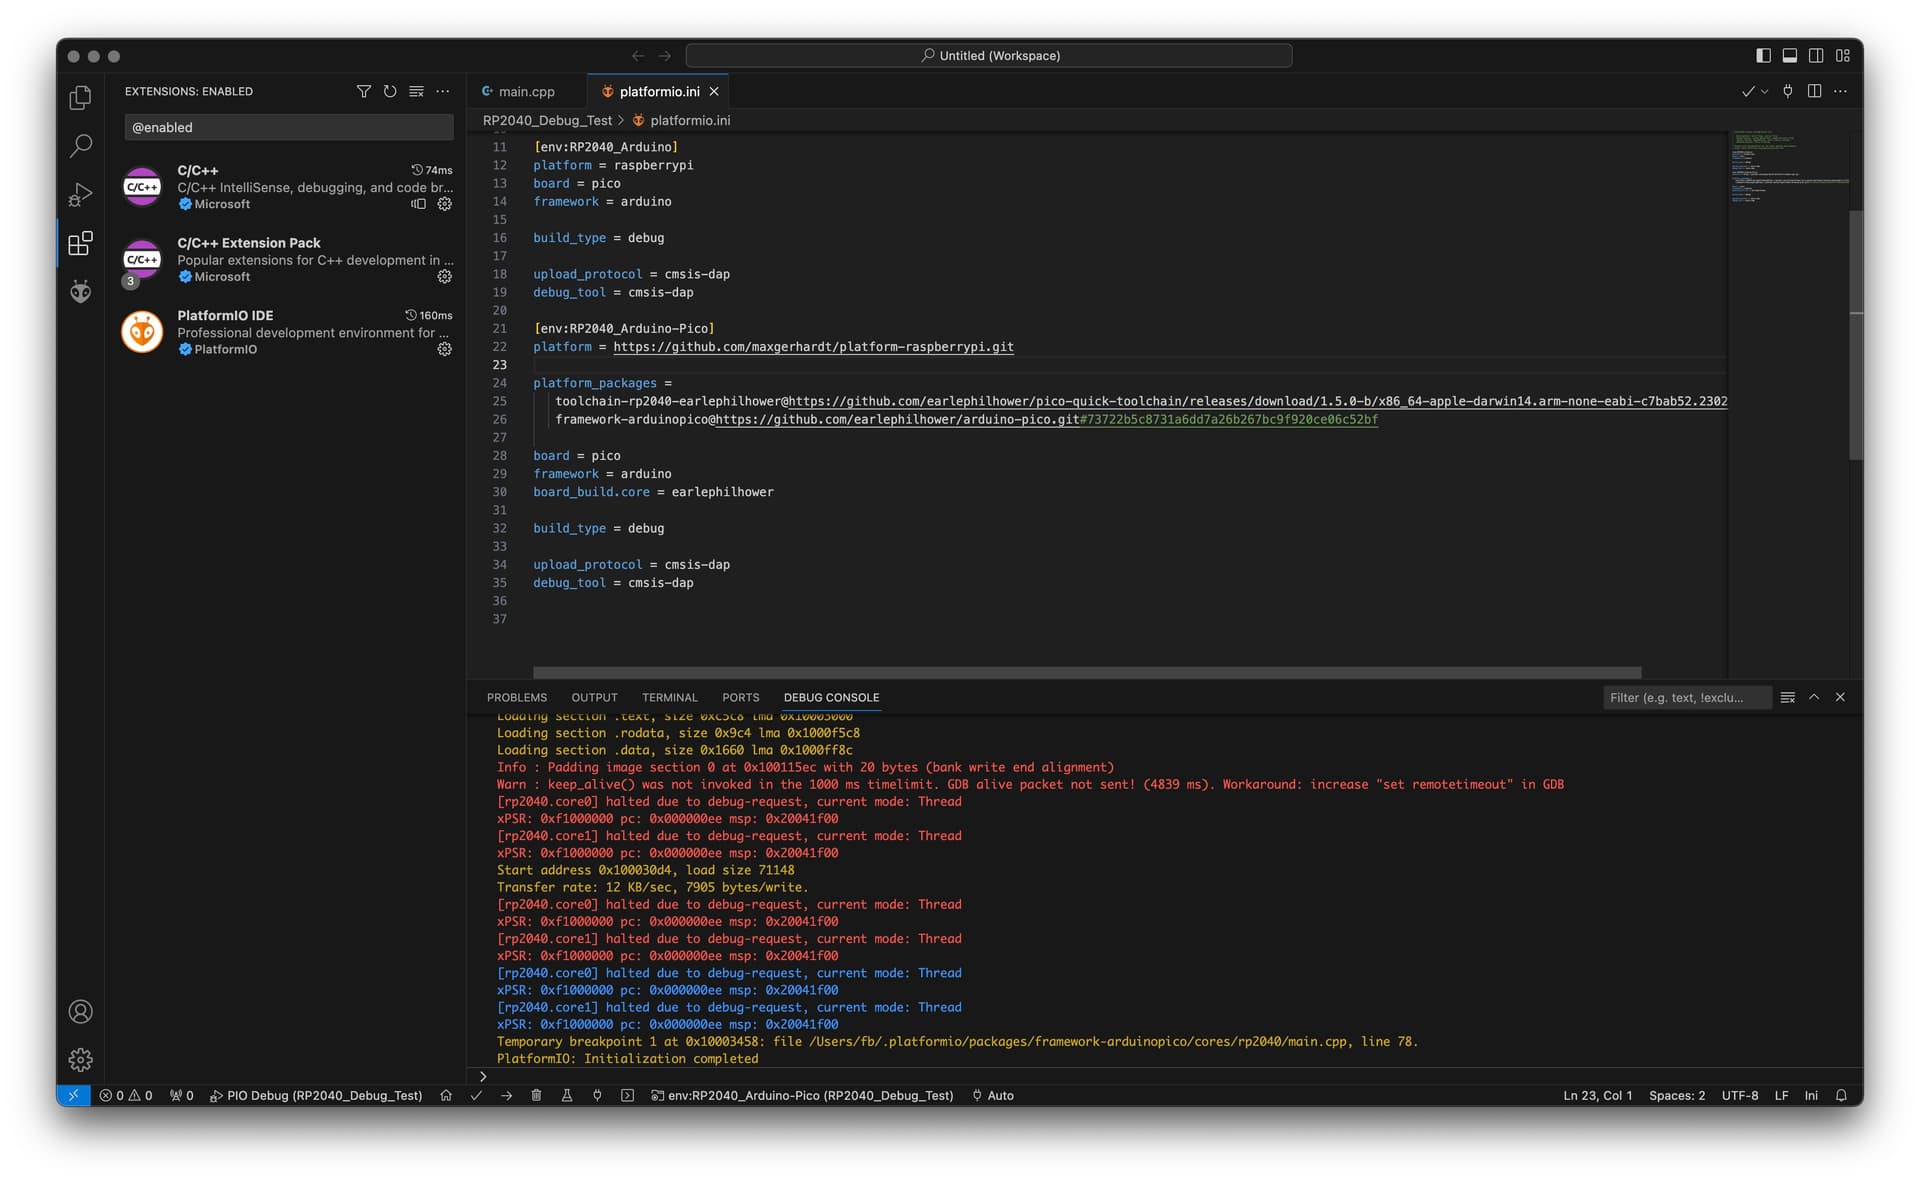
The outcome also does not change with disabling all extension except PlatformIO and C++, as you can see from the screenshot.
Is there a chance, that a coming PlatformIO update will get this to work? It appears, I am the only one having this issue.
I am also seeing the fatal error Fatal signal: Abort trap 6 Backtrace unavailable on mac.
I could get the default breakpoint at main, but it fails after resuming. Setting an alternative tbreak fails, and having another breakpoint set other than just default tbreak fails. Using a pico as picodebug cmsis-dap.
Edit: I can now hit breakpoints, and setting the initial break to a custom method name worked. I can’t seem to get debug output, just standard serial that my app prints, but that may be a conflict on my side.(listening to COM4 and COM6 for both Pico’s)